grafana-aio11y-demo
A self-contained demo of AI observability on Grafana Cloud. One terraform apply into your own AWS account, EKS cluster and Grafana Cloud stack stands up a small AI application, a small team of Claude Code developers, and Amazon Bedrock's own telemetry, all landing in one Grafana Cloud stack. One terraform destroy removes it.
This is a personal demo project, not an official Grafana Labs product.
Who this is for
Anyone who wants a working, disposable example of what AI observability on Grafana Cloud looks like end to end: in-app AI agents, developers using a coding agent through a gateway, and the underlying model provider's own telemetry, all correlated in the same stack. Useful for a presenter preparing a demo, or as a reference architecture to copy pieces from.
What it demonstrates
In-app agents on Amazon Bedrock
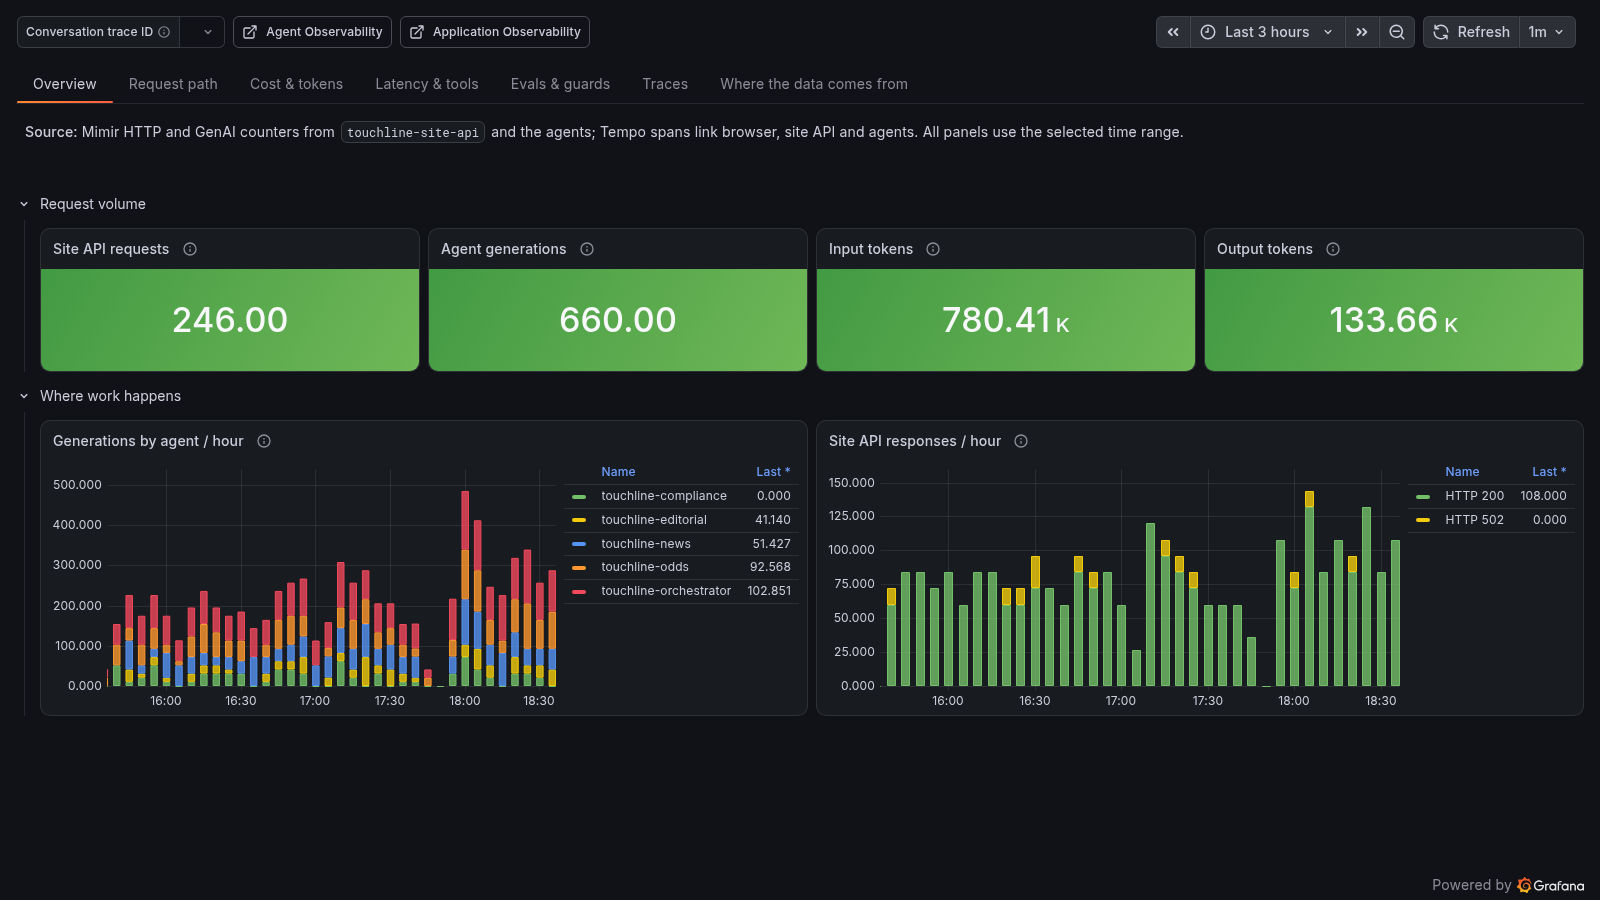
Touchline Times, a fictional sports newspaper, has an AI match desk: an orchestrator routes a reader question to news, odds, editorial and compliance agents, which call shared tools (odds, news, head-to-head history, offers) and answer through Bedrock. Every call is traced with OpenTelemetry and recorded as a generation in Grafana Agent Observability, with online evaluations (groundedness, PII, responsible-gambling language), a prompt-injection guard on tool results and scheduled experiments comparing prompt variants and models.
Claude Code developers through the Claude apps gateway
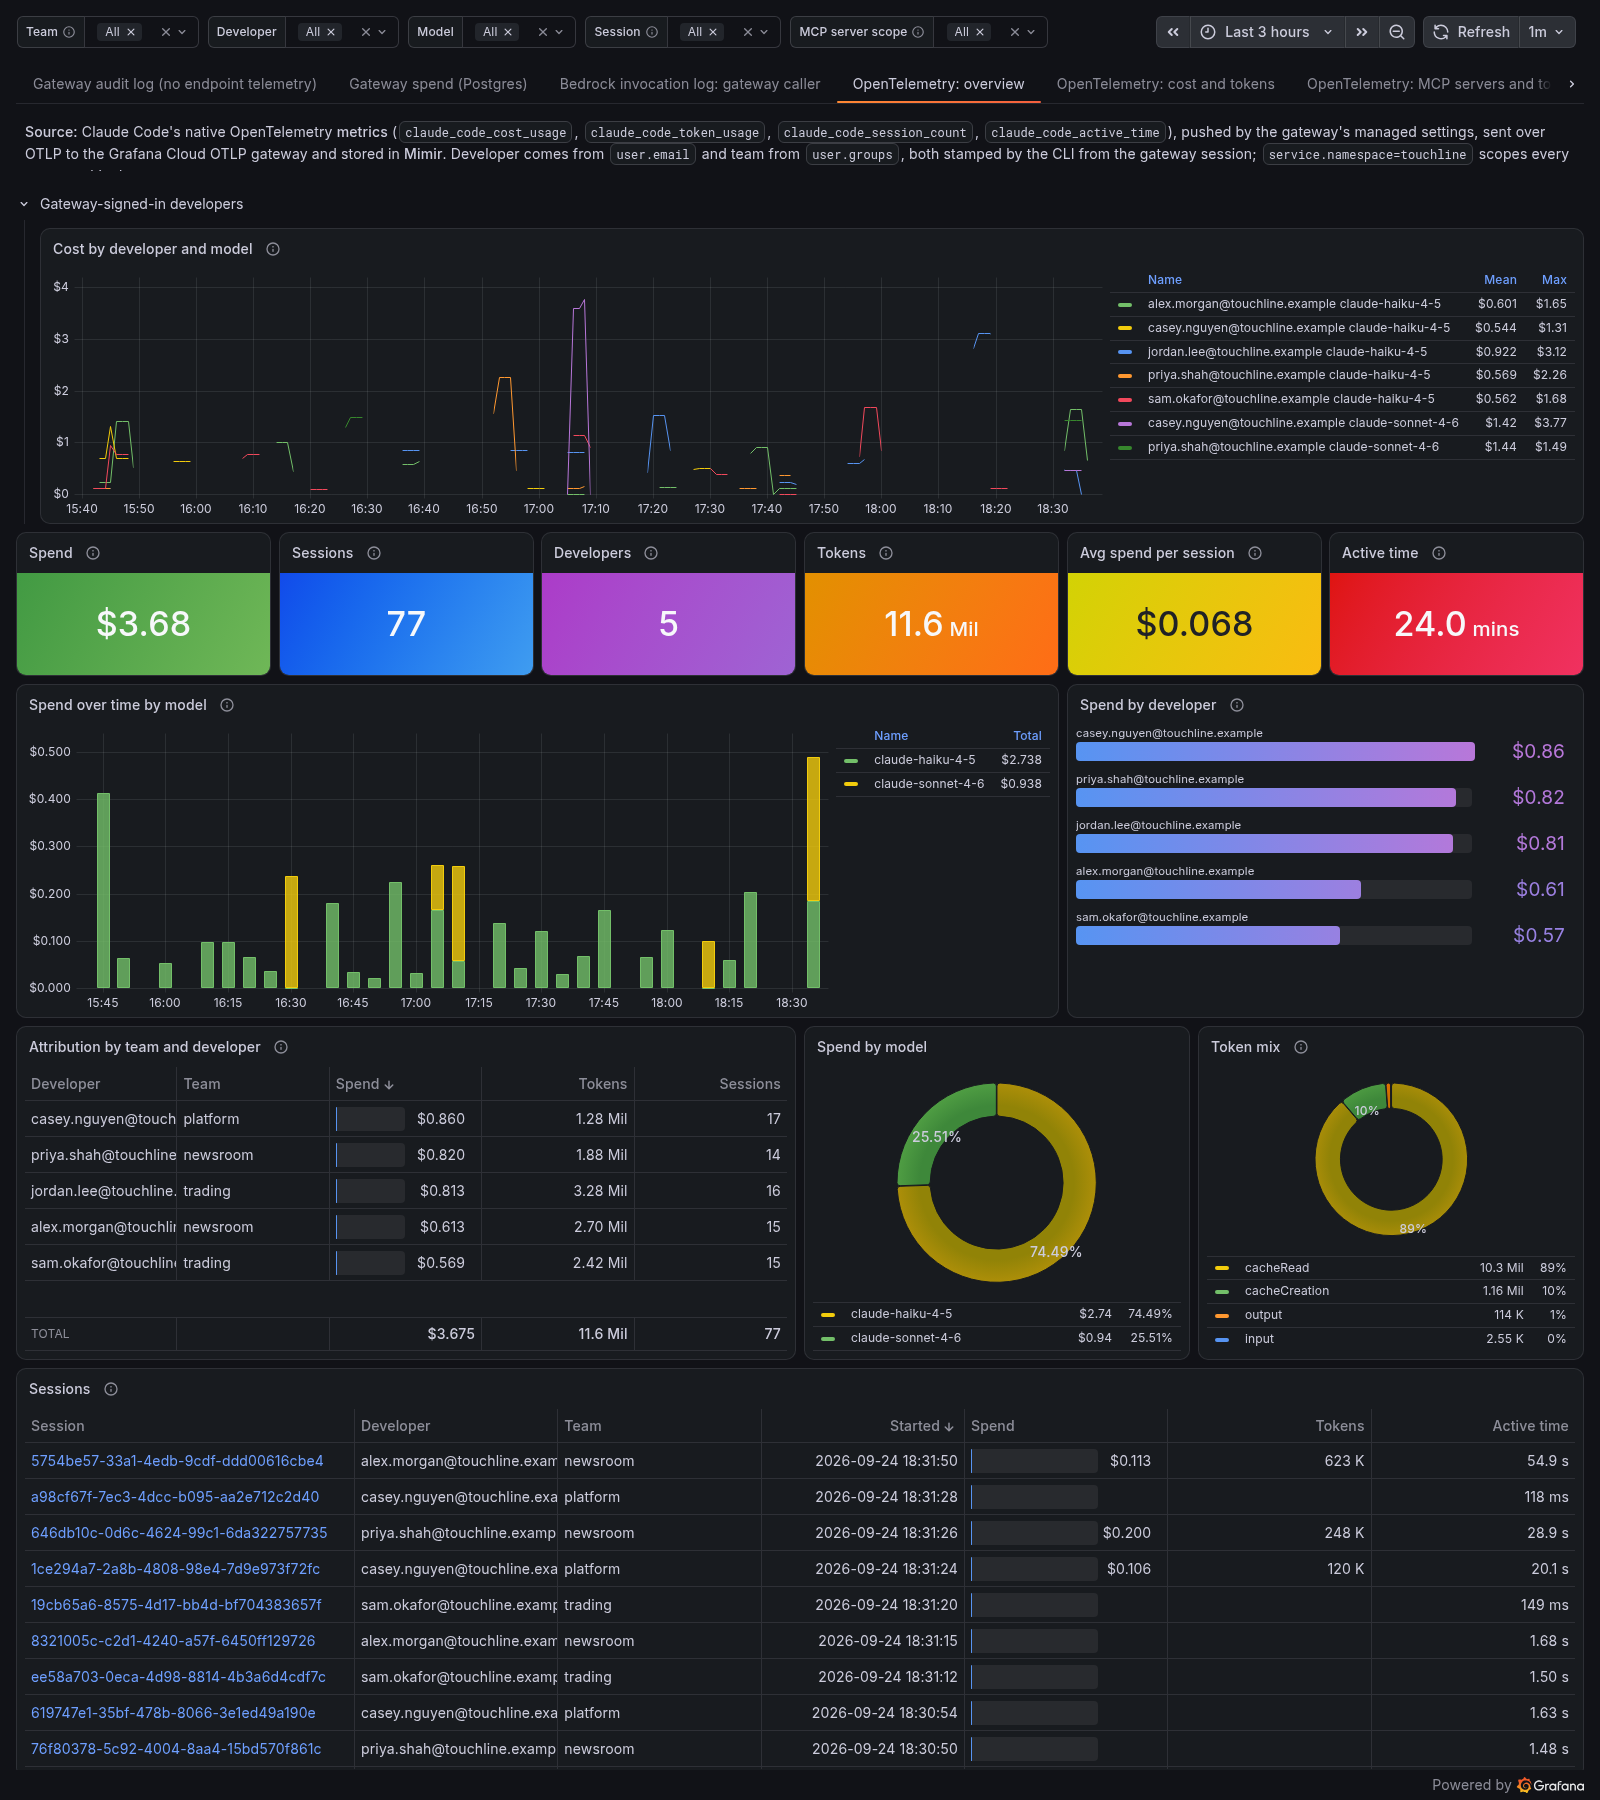
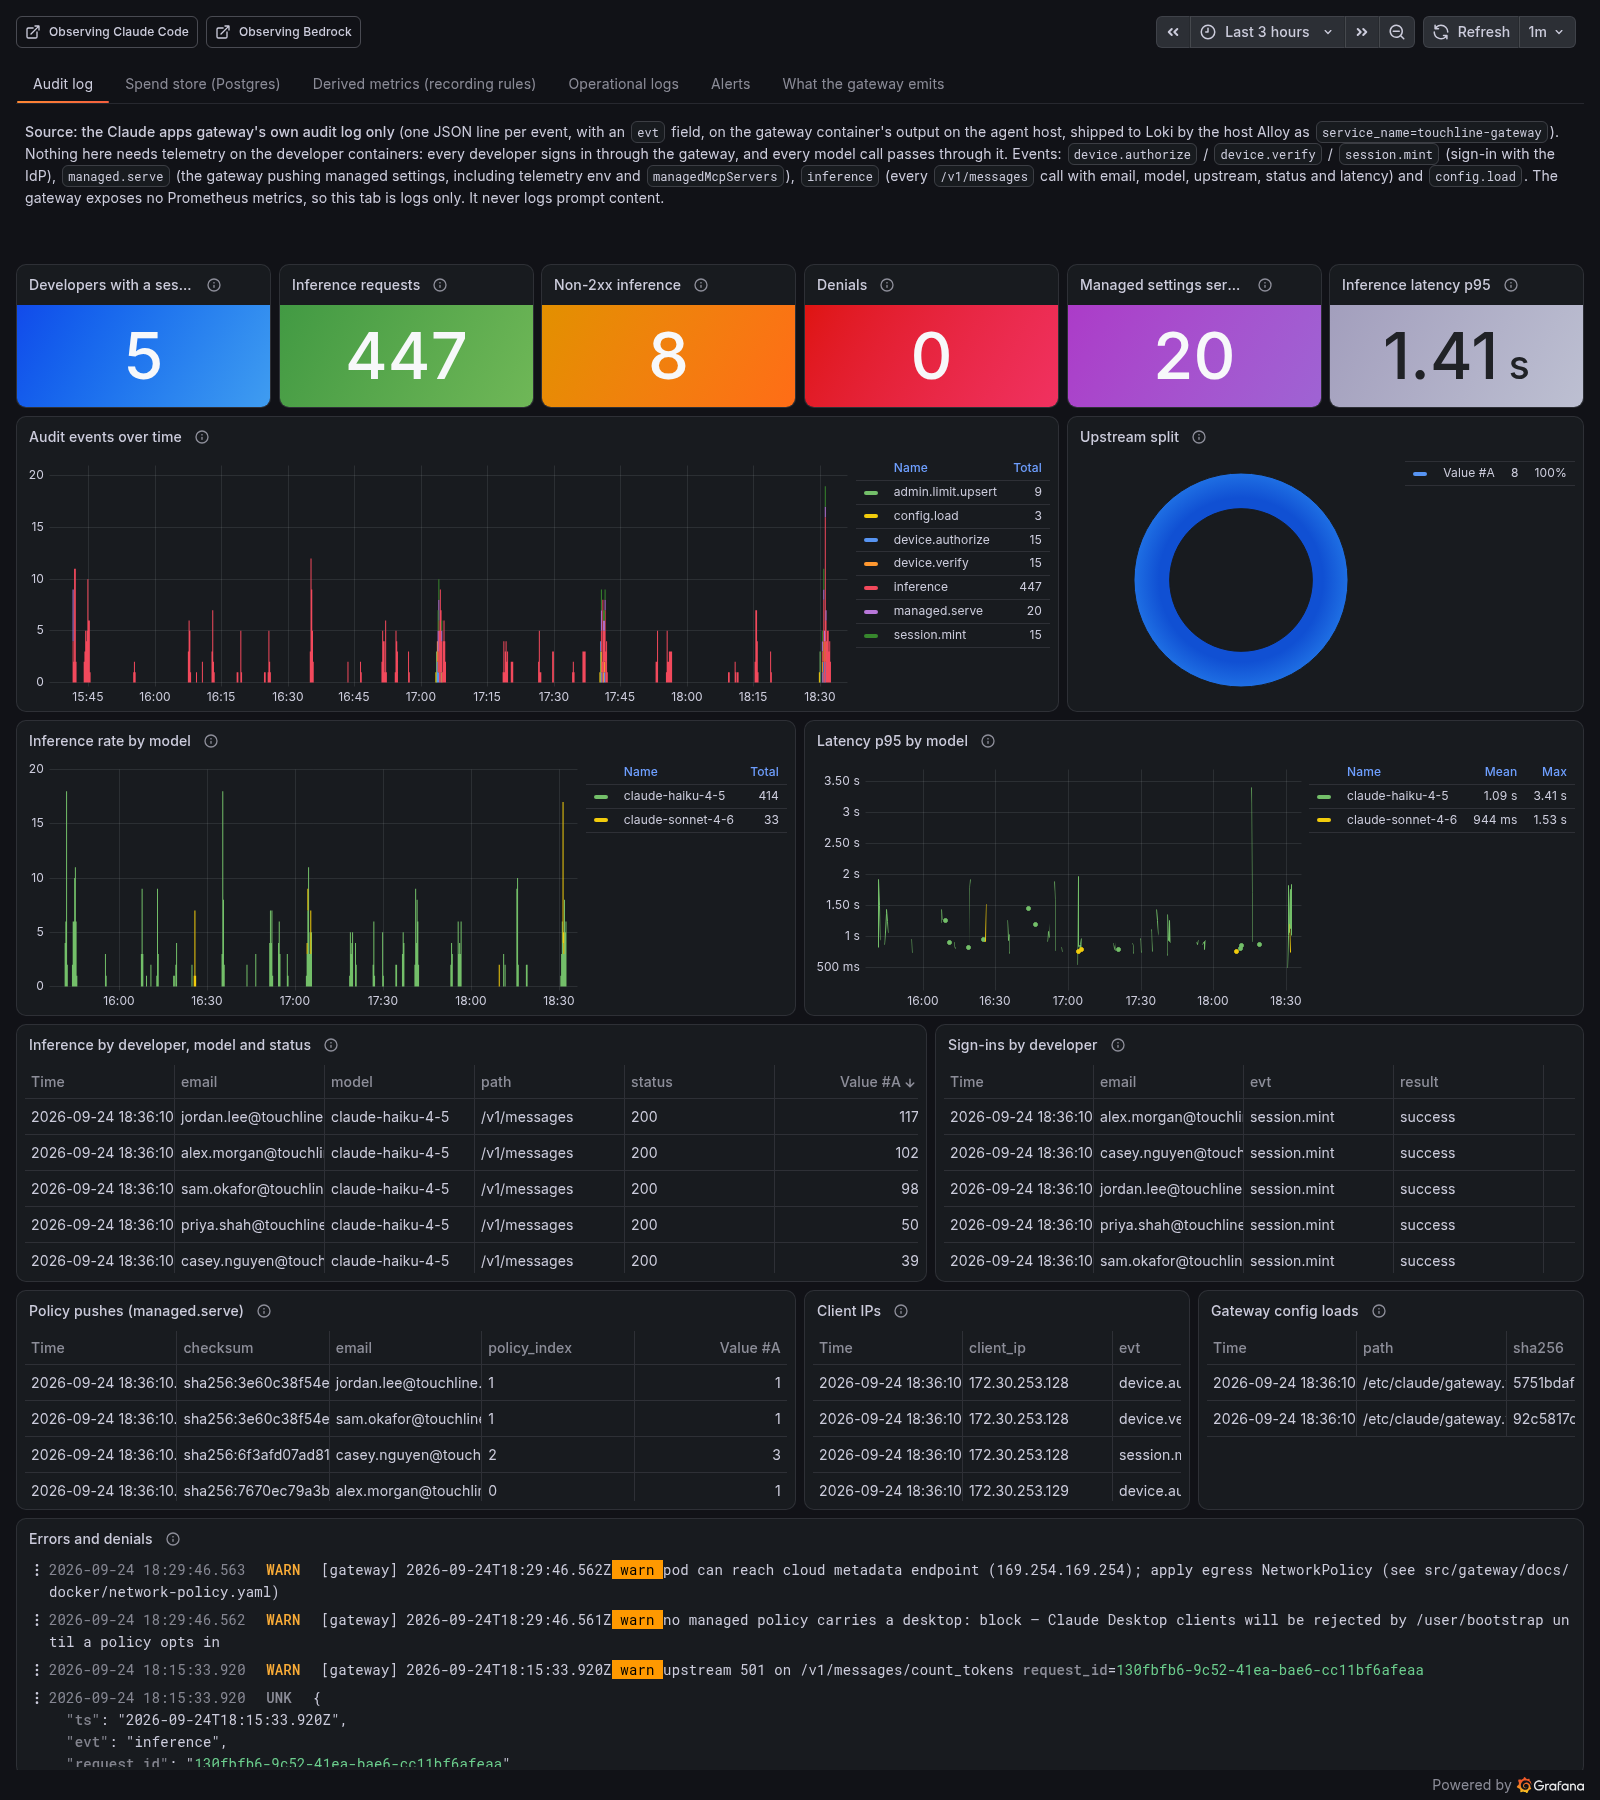
Five developers in three teams (newsroom, trading, platform) run Claude Code in containers on one EC2 host. They sign in to the Claude apps gateway with Amazon Cognito, and the gateway holds the Bedrock credential, decides which models each team can use, enforces per-organization, per-team and per-developer spend caps, and pushes managed settings: OpenTelemetry export, MCP servers and the Agent Observability plugin. The plugin sends every prompt and tool call through Cloud guards (a PII deny guard, secret and PII redaction, content safety) and makes sessions available to online evaluations.
Bedrock's own view
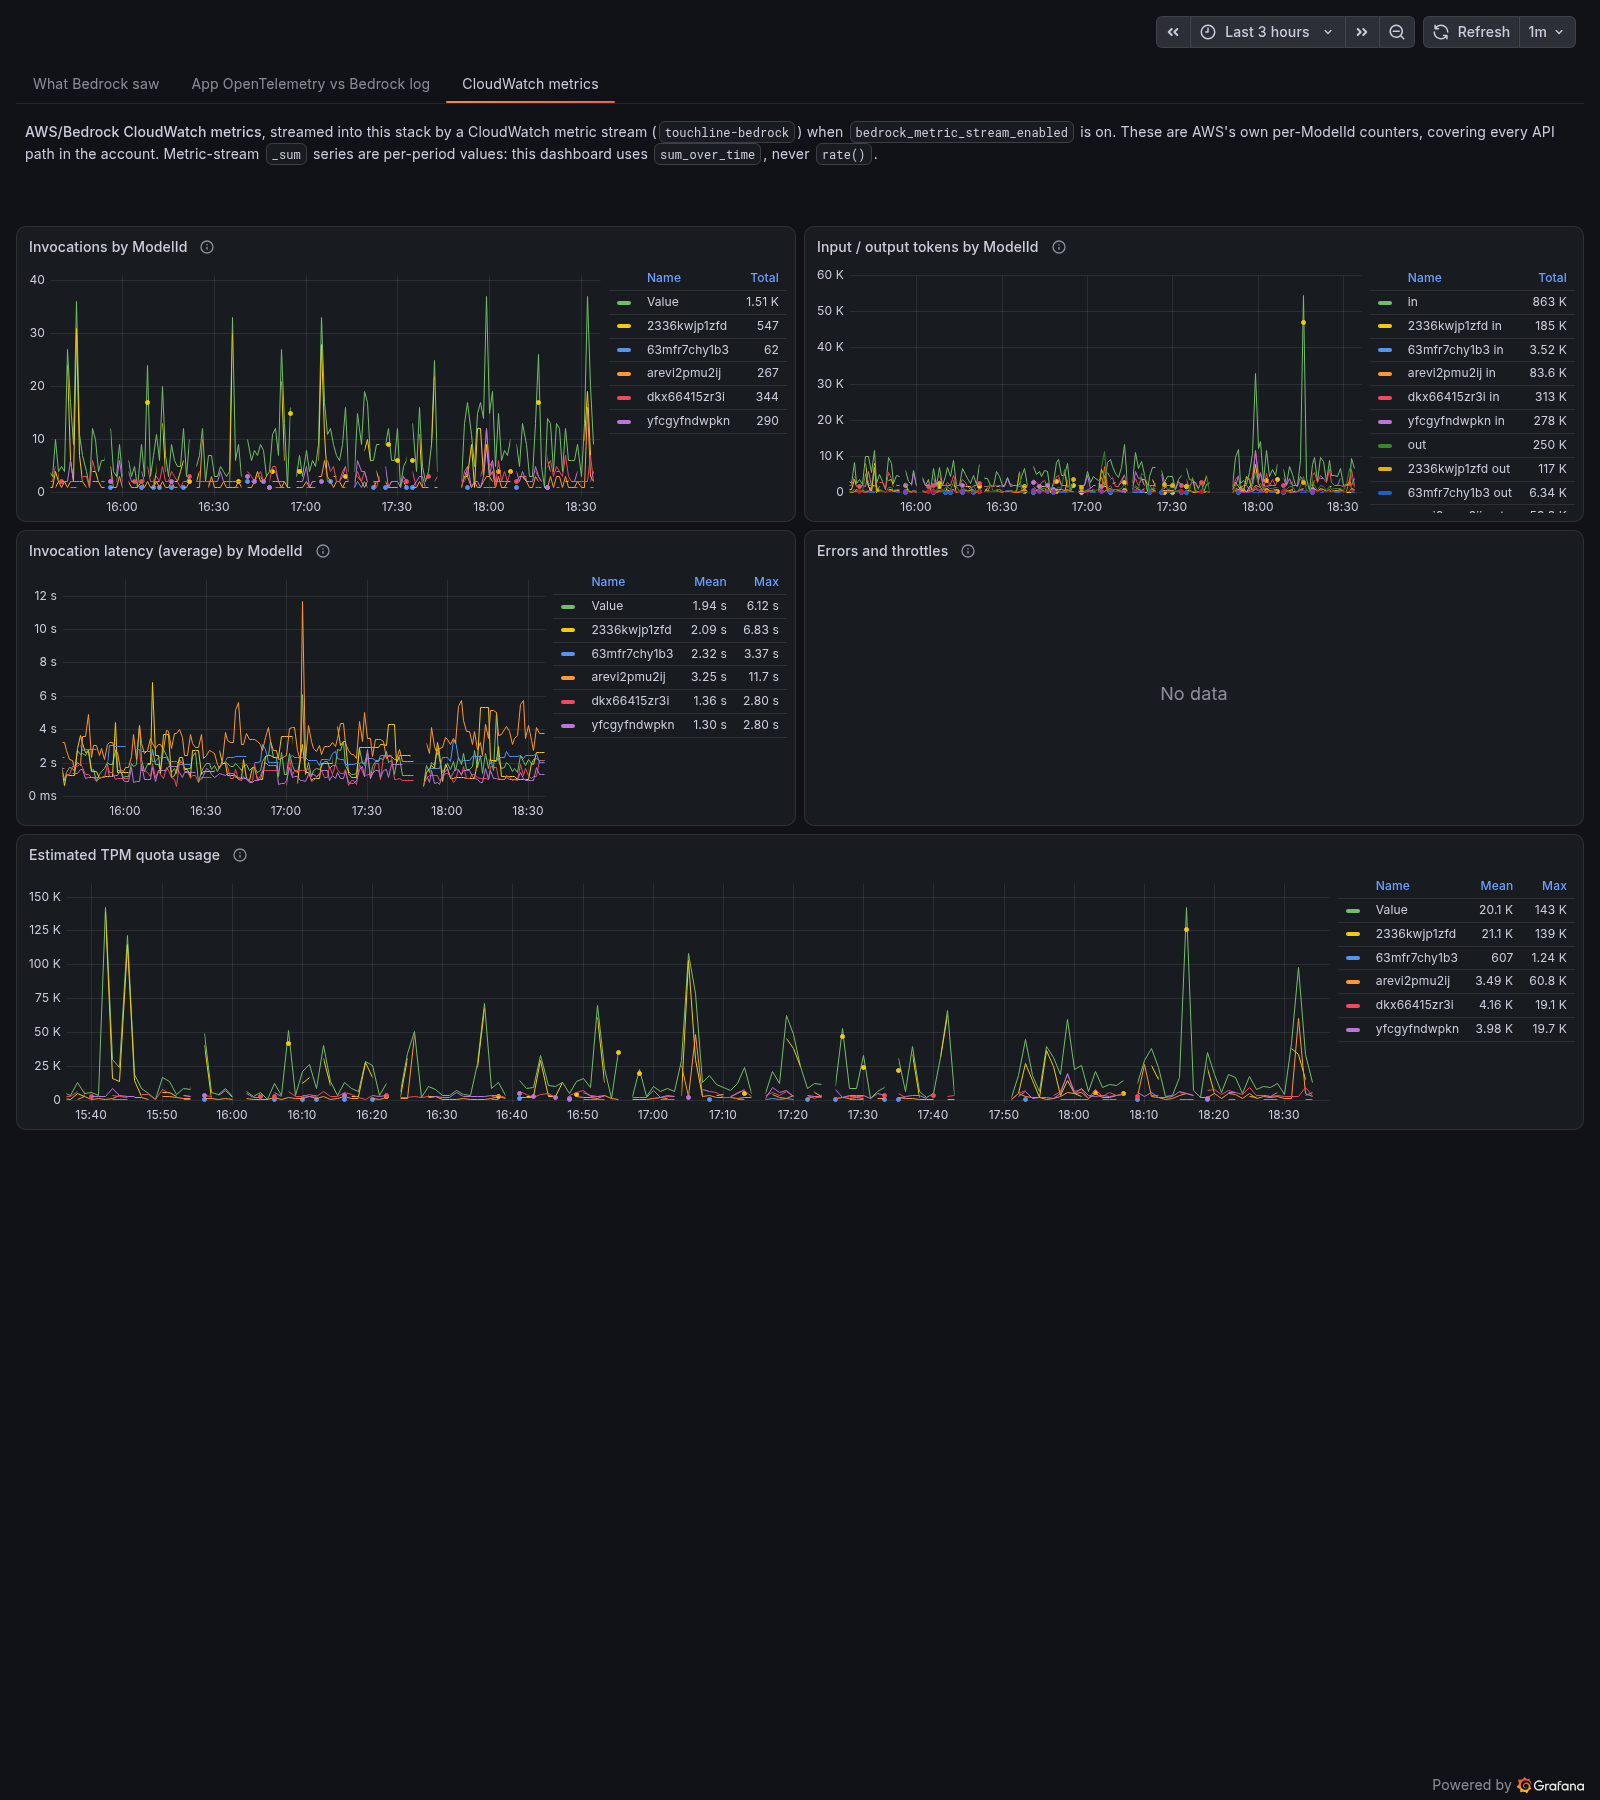
A CloudWatch metric stream sends the AWS/Bedrock namespace to Grafana Cloud Metrics, and optional model invocation logging sends Bedrock's per-call log to Grafana Cloud Logs. Per-team application inference profiles make AWS-side attribution possible without the gateway.
Everything in one Grafana Cloud stack
Four dashboards (in-app agents, Bedrock, Claude Code, the gateway), each tab labelled by the data source behind it; Grafana-managed recording and alert rules (spend, guard denies, errors, latency, throttling) on simplified routing to a contact point that pages nobody; a spend datasource that reads the gateway's own Postgres through Private Data Source Connect; Application Observability, Frontend Observability for the site and a Knowledge Graph rule that joins the services.
Architecture
flowchart LR
  subgraph AWS["Your AWS account"]
    subgraph EKS["EKS cluster, namespace touchline"]
      site["site API + Redis"] --> orch["orchestrator agent"]
      orch --> spec["news / odds / editorial / compliance agents"]
      loadgen["load generator"] --> site
      exp["experiments CronJob"] --> orch
      alloy["Alloy collector"]
      site -. OTLP .-> alloy
      orch -. OTLP .-> alloy
      spec -. OTLP .-> alloy
    end
    subgraph Host["EC2 agent host (SSM only, no inbound)"]
      devs["5 Claude Code developer containers"] --> gw["Claude apps gateway"]
      gw --> pg[("gateway Postgres")]
      pdc["PDC agent"] --> pg
      halloy["host Alloy"]
    end
    cognito["Amazon Cognito"]
    bedrock["Amazon Bedrock\nper-team application inference profiles"]
    cw["CloudWatch metric stream\n+ invocation logging (opt-in)"] --> fh["Firehose"]
    orch --> bedrock
    spec --> bedrock
    gw --> bedrock
    gw -. OIDC .-> cognito
    bedrock --> cw
  end
  subgraph GC["Grafana Cloud stack"]
    otlp["OTLP gateway: Mimir, Loki, Tempo"]
    ao["Agent Observability\nevaluators, guards, experiments"]
    dash["dashboards, recording and alert rules,\nApp O11y, Frontend O11y, Knowledge Graph"]
  end
  alloy --> otlp
  spec -->|generations| ao
  orch -->|generations| ao
  gw -->|telemetry forward_to| otlp
  devs -->|agento11y plugin| ao
  halloy --> otlp
  fh --> otlp
  pdc -. tunnel .-> dash
More detail, including per-component diagrams, in Architecture.
Quick links
- Getting started: prerequisites, then a ten-minute quickstart
- Architecture: components, data paths, naming
- Data source tiers: what each telemetry tier sees, mapped to dashboard tabs
- Demo runbook: a presenter flow with what to click and what to say
- Coding agents and the gateway: the agent host, sign-in, developers, teams and spend caps
- Deploy alternatives: Argo CD, Flux or kubectl for the workloads
- Security: content capture, tokens in state, exposure, guard scope
- Cost: what it costs to run and how to cap it
- Troubleshooting
- Teardown
- Reference: Terraform inputs and outputs
- Reference: Helm chart values
Licence
Apache-2.0. Source and issues: GitHub.