Dashboards and alerts
The builder publishes eleven dashboards on the nominated write stack. The table below describes their current panel groups. Each dashboard has a development-stack screenshot rendered over a 24-hour range and reviewed for identifiers, not a current estate measurement. Cadences below are module defaults; deployment overrides may differ. See the operator timetable for schedule times and the default UTC timezone.
Scan-fed dashboards include coverage and input-age panels. A blank or missing series is not a measured zero. The Stack selector does not filter panels that read the live grafanacloud-usage datasource, which identifies stacks by numeric id rather than the selector's slug. See source and interpretation traps before comparing unlike populations.
Estate
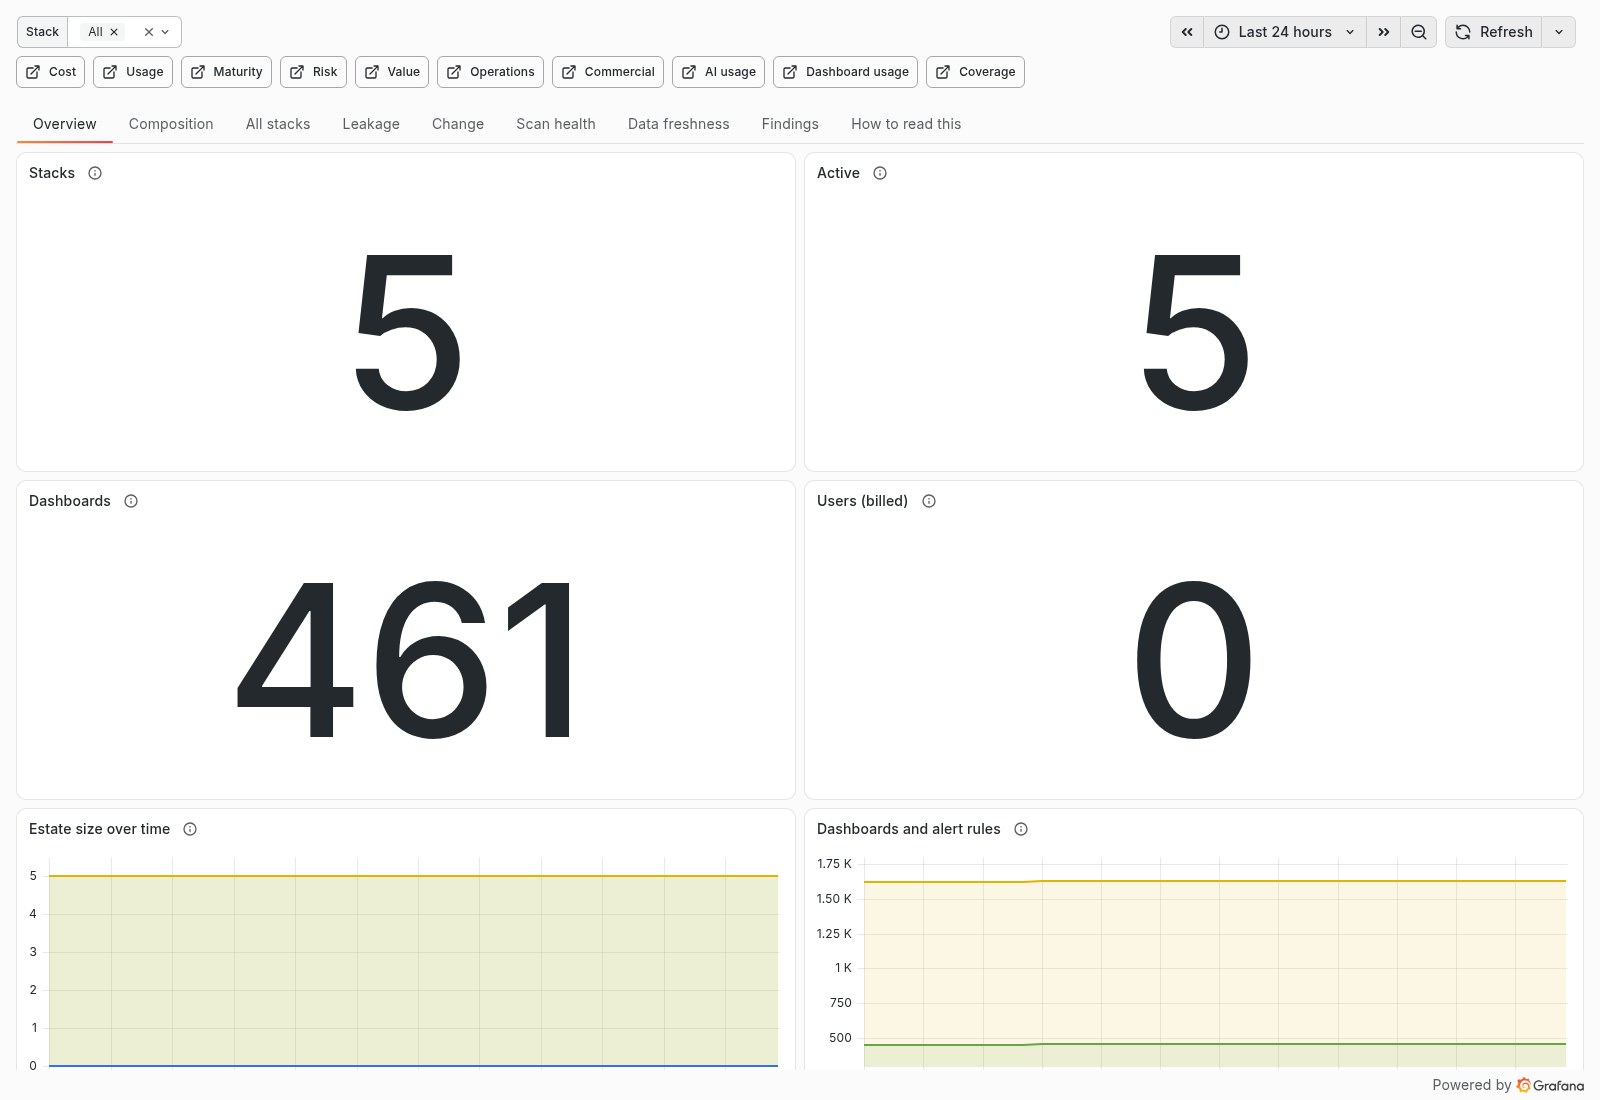
| Row or tab | Question answered | Source and window |
|---|---|---|
| Overview, Composition, All stacks | What exists, where, and in what state? | Hourly org inventory and stack detail hydrated from its daily sweep. |
| Leakage, Change | Which identities or resources remain, and what changed? | Collector inventories and daily 1-day and 7-day diff. |
| Scan health, Data freshness | Which inputs and stacks were measured recently enough to trust? | Completion and input-age metrics. |
Inventory is configured state. A stack missing from a scan is not a deleted stack. Read the denominators and input ages. Inventory traps.
Cost
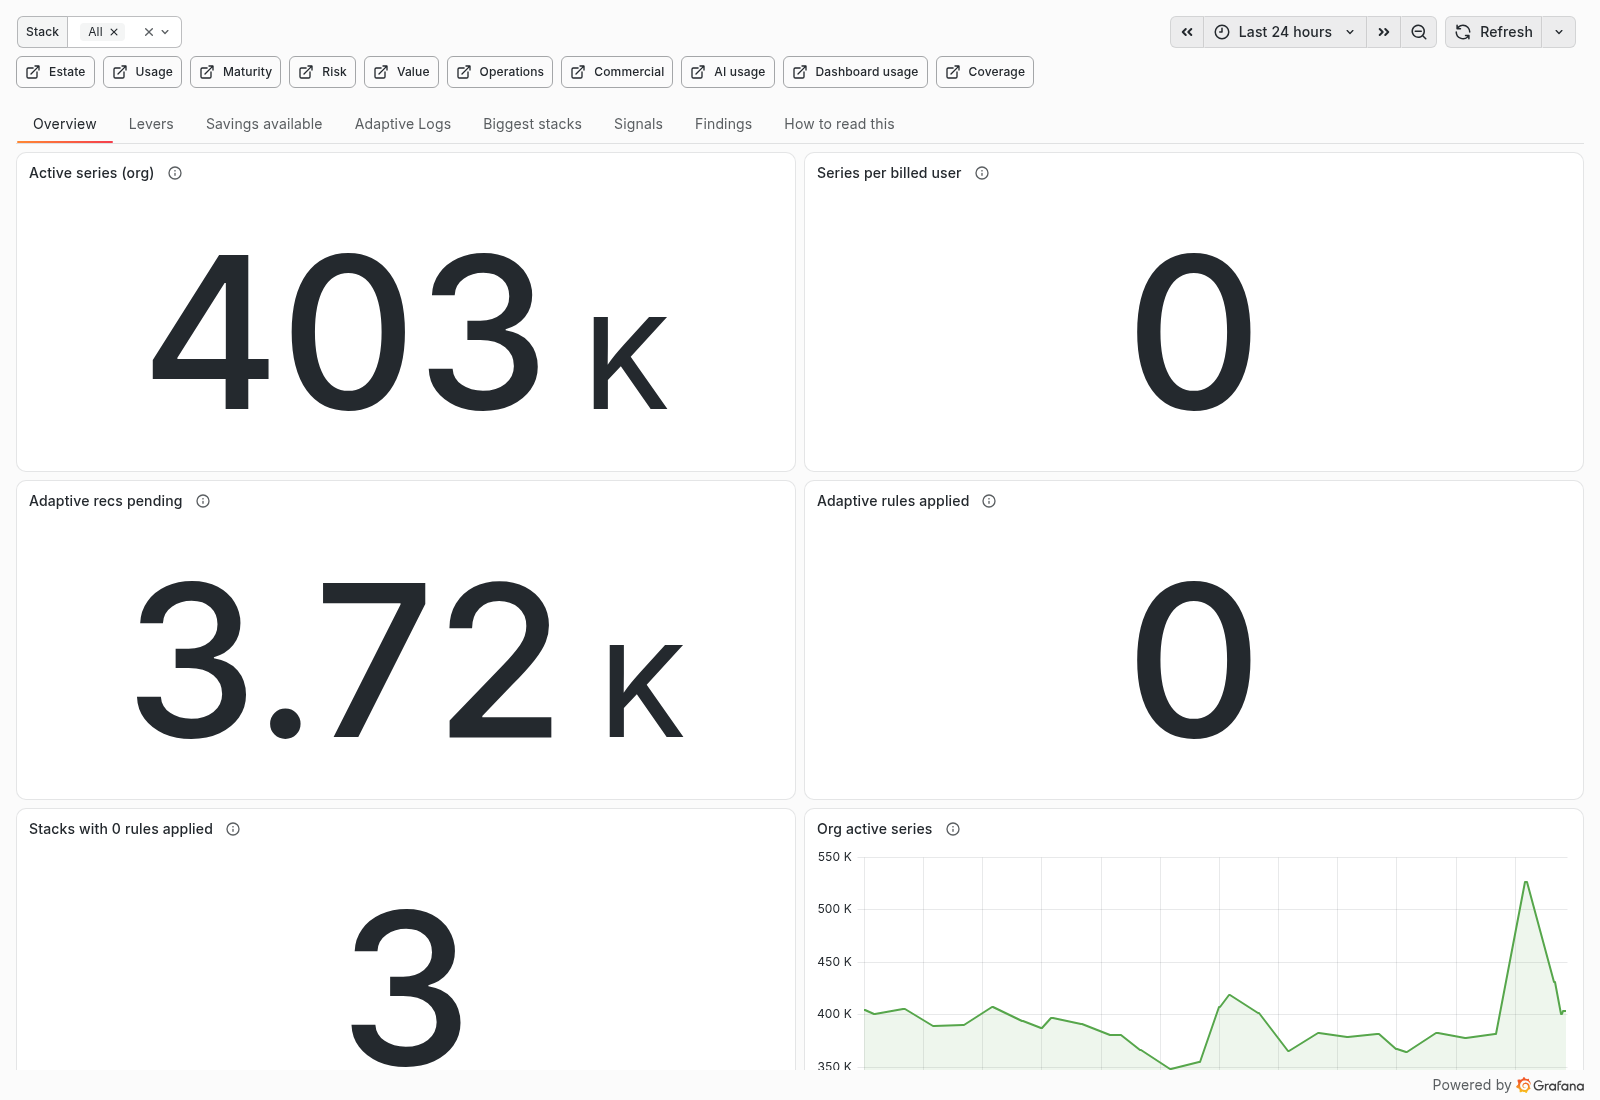
| Row or tab | Question answered | Source and window |
|---|---|---|
| Overview, Biggest stacks, Signals | Where is consumption concentrated? | Collector cardinality and stack data plane, refreshed every 6 hours. |
| Levers, Savings available, DPM-aware savings | Which Adaptive Metrics changes have a supported saving? | Rules and verbose recommendations from the data-plane sweep; optional complete price basis. |
| Adaptive Logs | What reduction is proposed and already realised? | Daily recommendation sweep plus live billing datasource for realised drop. |
Potential savings sum positive marginal reductions for add and update recommendations; active series is not the saving. Monetary estimates are absent without a complete rate card. Live billing panels have their own window and are not filtered by Stack. Adaptive and pricing traps.
Usage
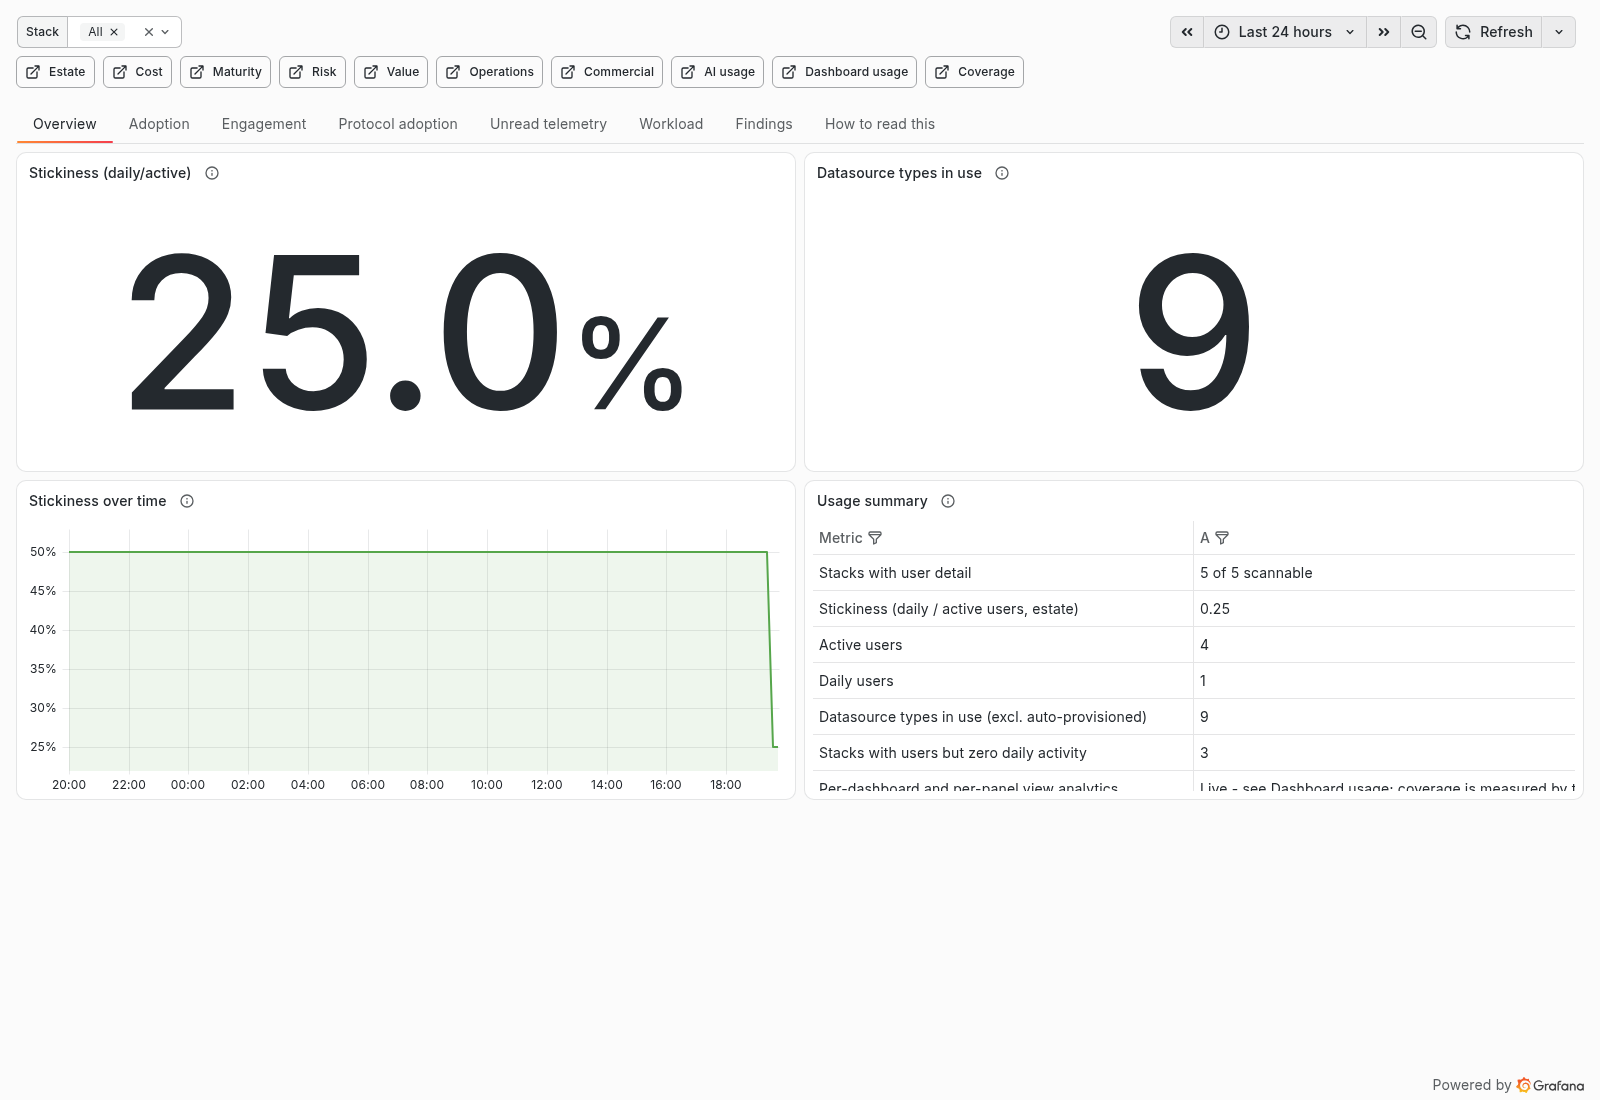
| Row or tab | Question answered | Source and window |
|---|---|---|
| Overview, Adoption, Engagement | Which datasource types and capabilities are provisioned, and where is there recorded use? | Daily stack inventory and collector signals. |
| Protocol adoption, Unread telemetry, Workload | What telemetry arrives, through which protocol, and which resources carry it? | Explicitly windowed signal inventory and data-plane measurements. |
Provisioning and production are distinct from human use. A sentinel detects its declared technology from a curated metric-name registry; the unmatched share remains visible and generic names are not treated as proof. Signal classification traps.
Maturity
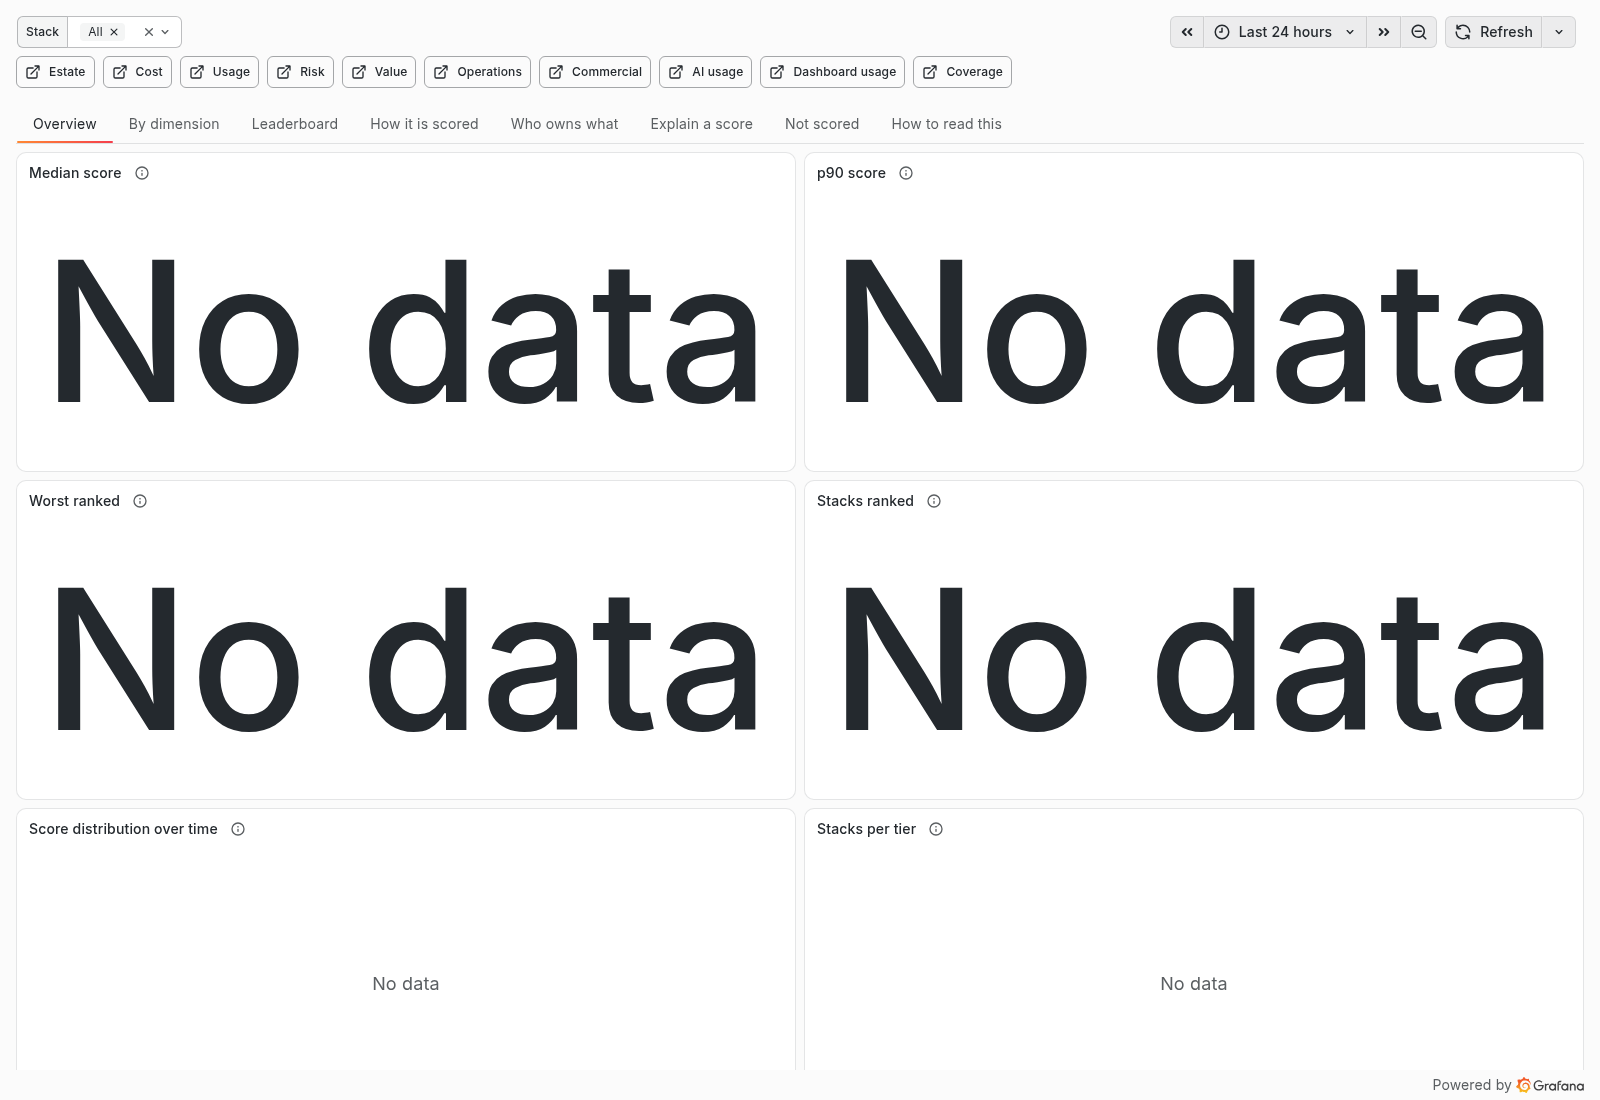
| Row or tab | Question answered | Source and window |
|---|---|---|
| Overview, By dimension, Leaderboard | How do measured stacks score and rank? | Daily stack detail and 6-hour data plane. |
| How it is scored, Explain a score, Not scored | Which inputs contributed or were unavailable? | Collector score components and per-input provenance. |
| Who owns what | Which ownership information is present? | Stack and org inventory. |
A score covers measured and applicable components, not an assumed complete estate. An unscored component is not a zero. Denominator traps.
Risk
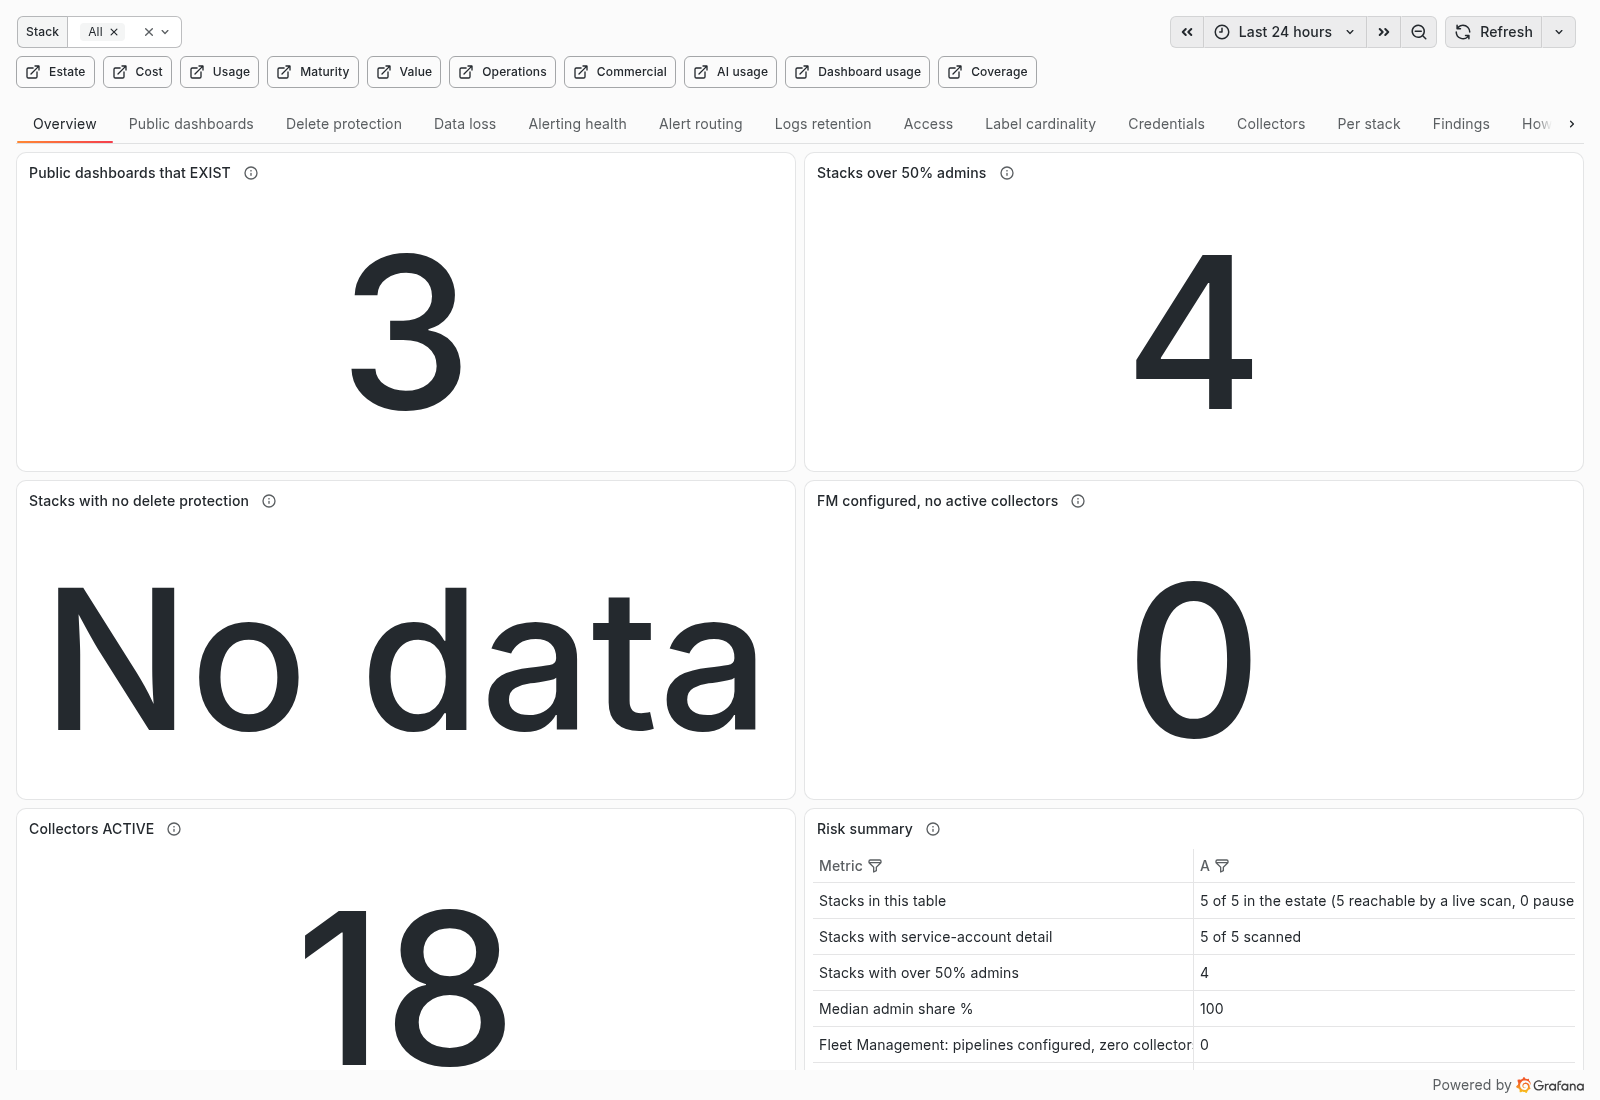
| Row or tab | Question answered | Source and window |
|---|---|---|
| Public dashboards, Delete protection, Access, Credentials | What exposure and access are configured? | Hourly org and daily stack inventories; daily public-share enumeration. |
| Data loss, Alerting health, Alert routing, Logs retention, Collectors | Where are gaps in collection, response configuration and retention? | Daily routing and retention, hourly Fleet, 6-hour data plane. |
| Label cardinality, Per stack | Which measured stacks need inspection? | Data-plane sweep and bounded finding views. |
| Label hygiene | Which sampled label keys and values have classified privacy or cardinality risk? | Bounded daily label-API sample and per-signal coverage. |
Label hygiene is a bounded sample, not an exhaustive audit. Full classified matches appear only in the approved S3 risk view and private hydration input, never in Loki or metric labels. The view requires explicit privacy acceptance and targeted retention; see Security.
Configured public shares include ones nobody opened. Dashboard usage separately records opens. Permission-filtered lists need their measured-stack denominator; an unreadable list is not empty. Public dashboard and routing traps.
Value
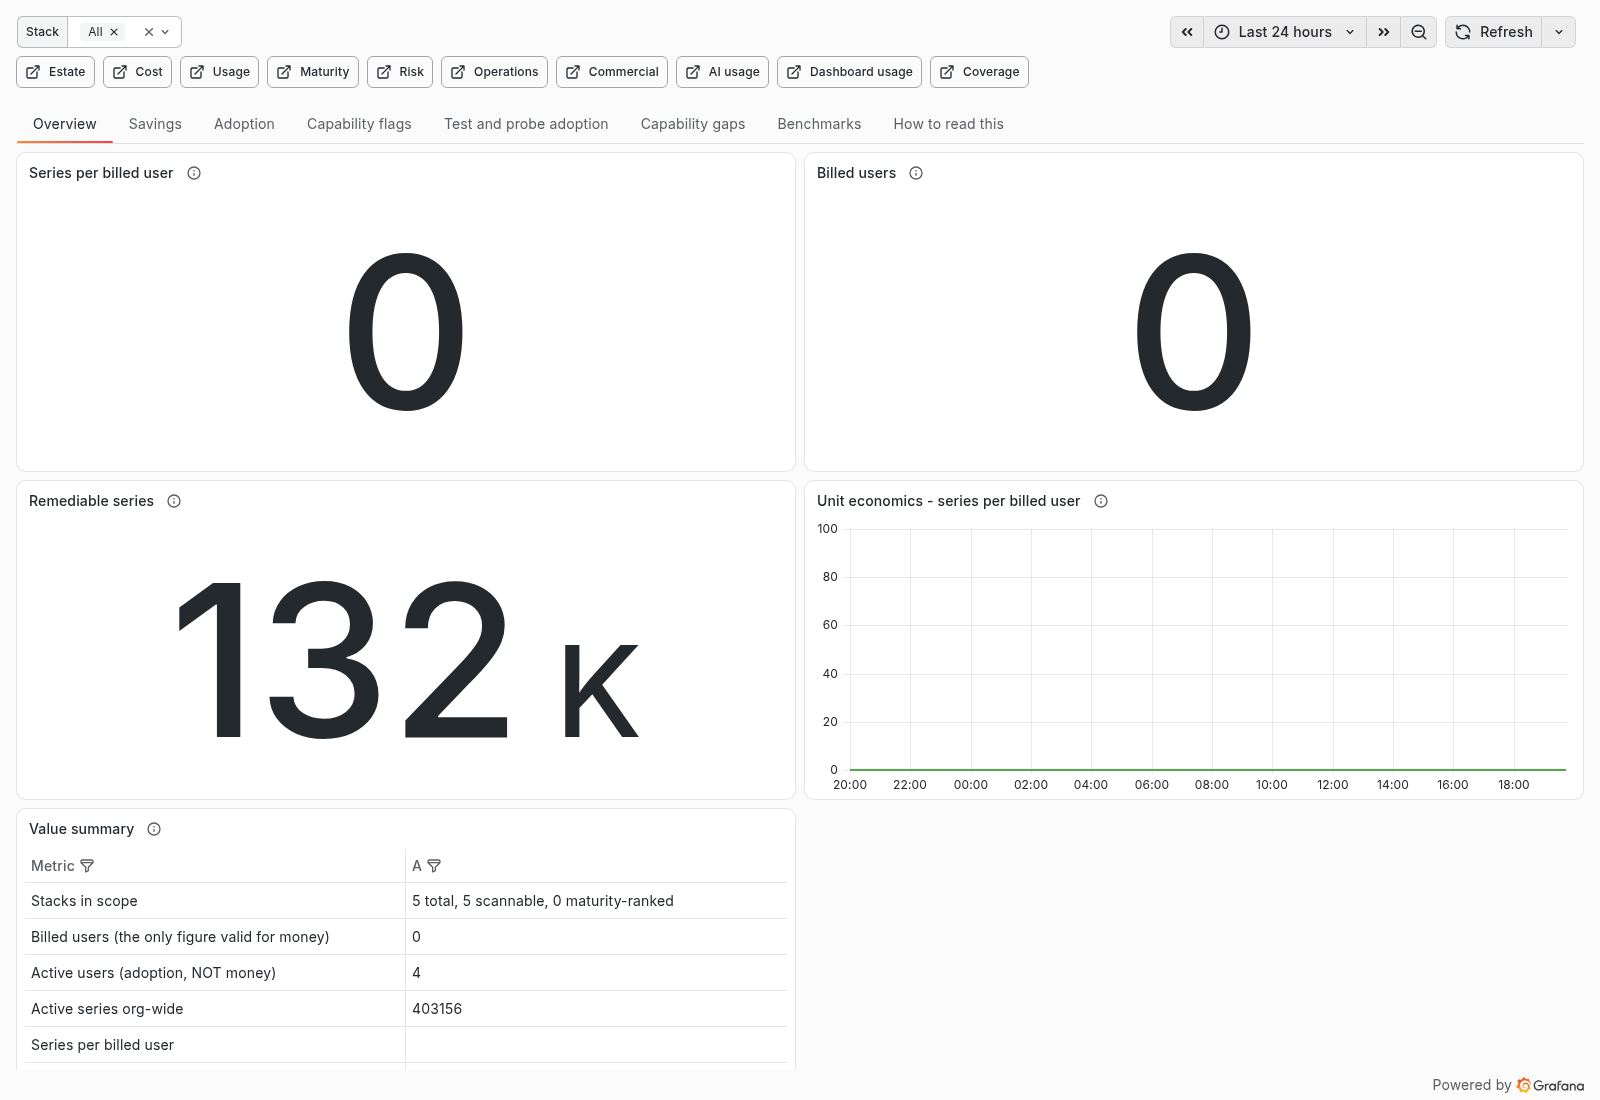
| Row or tab | Question answered | Source and window |
|---|---|---|
| Overview, Savings, Benchmarks | Which potential savings and unit comparisons have sufficient inputs? | Collector data plane and optional rate card. |
| Adoption, Capability flags, Test and probe adoption, Capability gaps | Which services or tests are configured or producing signals? | Daily inventory and measured usage signals. |
A missing or partially priced rate card withholds currency. Capability flags describe availability or configuration; they do not establish a person's use or a business outcome. Pricing traps.
Operations
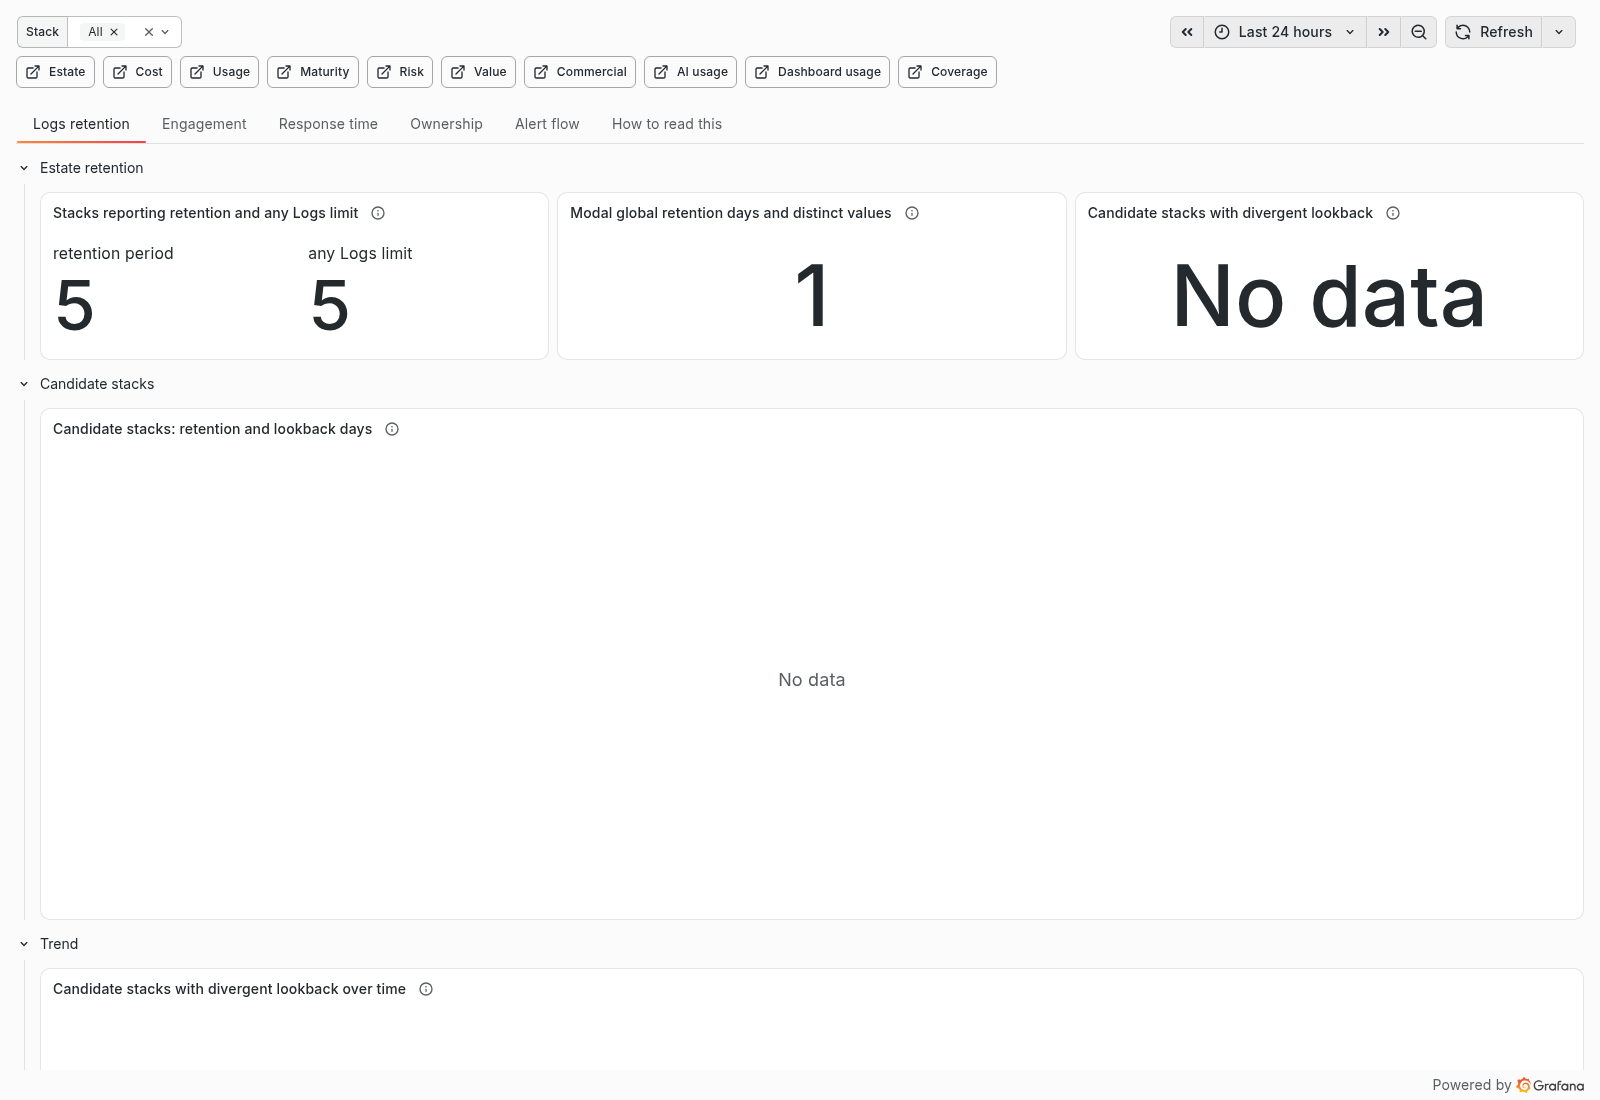
| Row or tab | Question answered | Source and window |
|---|---|---|
| Logs retention | Which billable log volume and retention shape is reported? | Live grafanacloud-usage. |
| Engagement, Response time, Ownership, Alert flow | Which OnCall groups have recorded acknowledgement, resolution or ownership? | Live grafanacloud-usage; rate panels use explicit 24-hour windows. |
These are panels over the existing billing datasource: no collector input or emitted series. Response ratios use only stacks with timing observations. A missing acknowledgement observation does not prove nobody looked. The Stack selector does not filter these panels. OnCall response traps.
Commercial
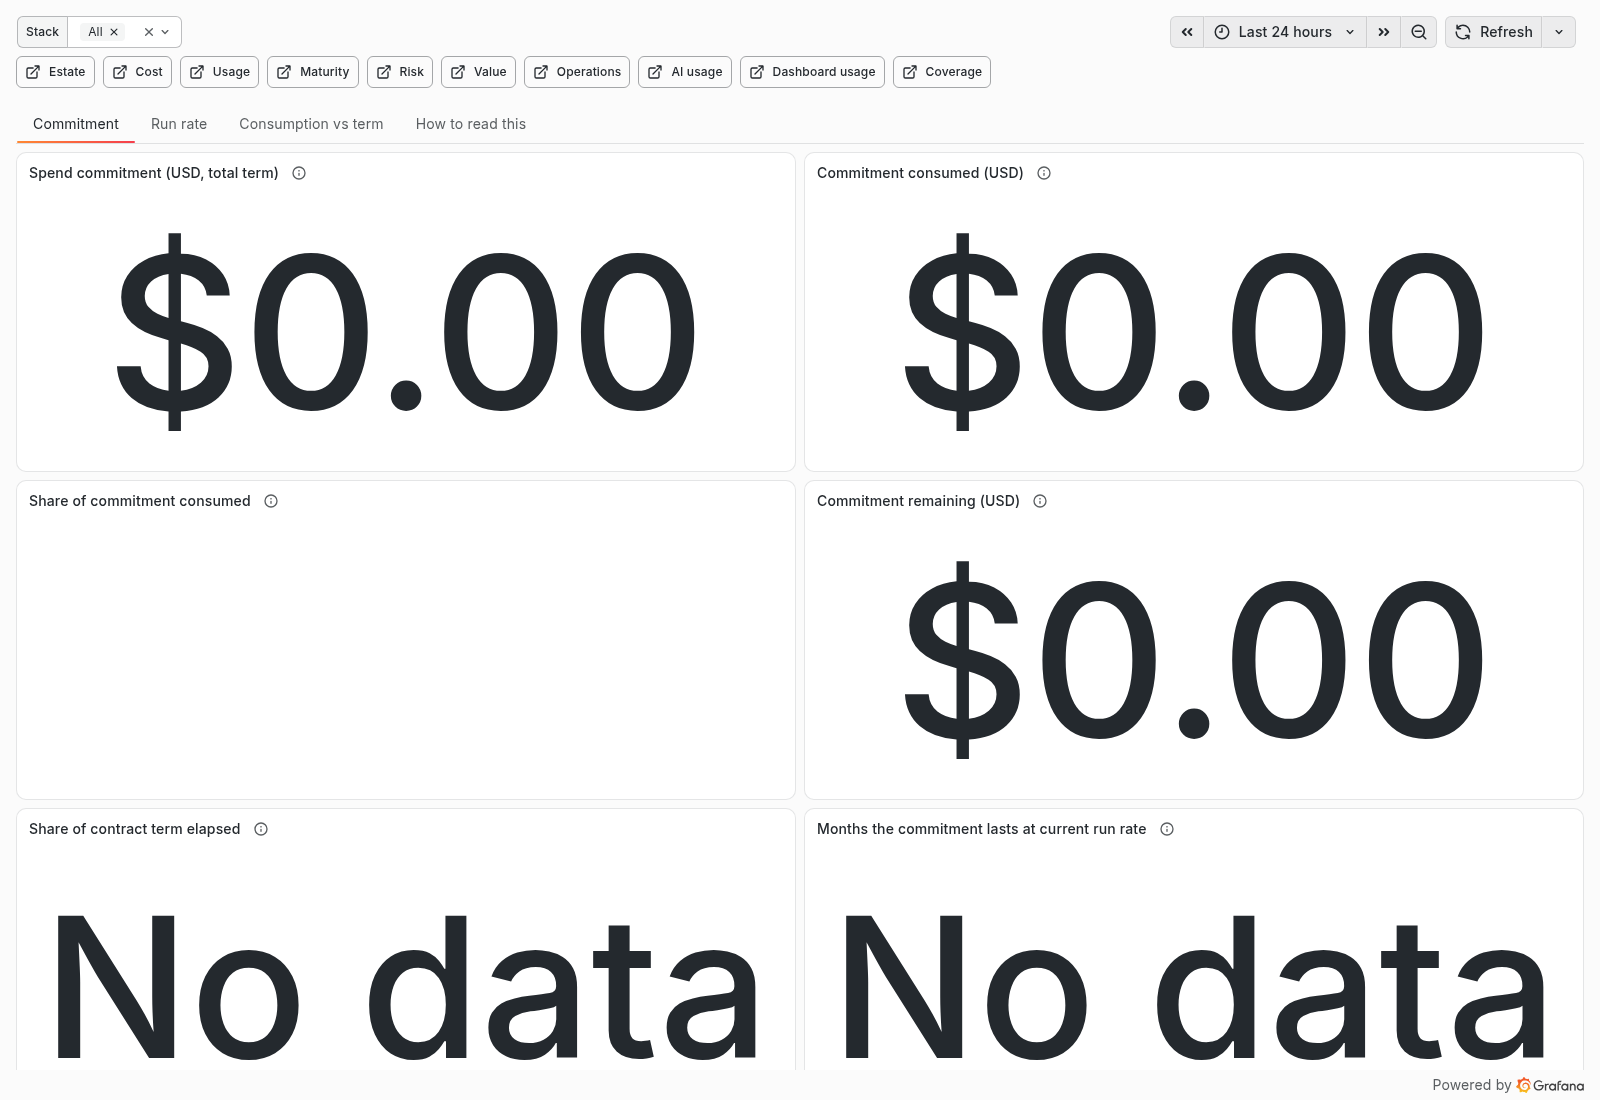
| Row or tab | Question answered | Source and window |
|---|---|---|
| Commitment | What is the contracted baseline shown by the datasource? | Live grafanacloud-usage. |
| Run rate | What does current billable consumption imply? | Live grafanacloud-usage, current billing period. |
| Consumption vs term | How does the reported run rate compare with commitment? | Live billing series and their declared periods. |
These panels need no collector credential or series. Money units and period interpretations are stated on the panels; they are derived where the source does not declare them. The Stack selector does not filter them. Billing datasource traps.
AI usage
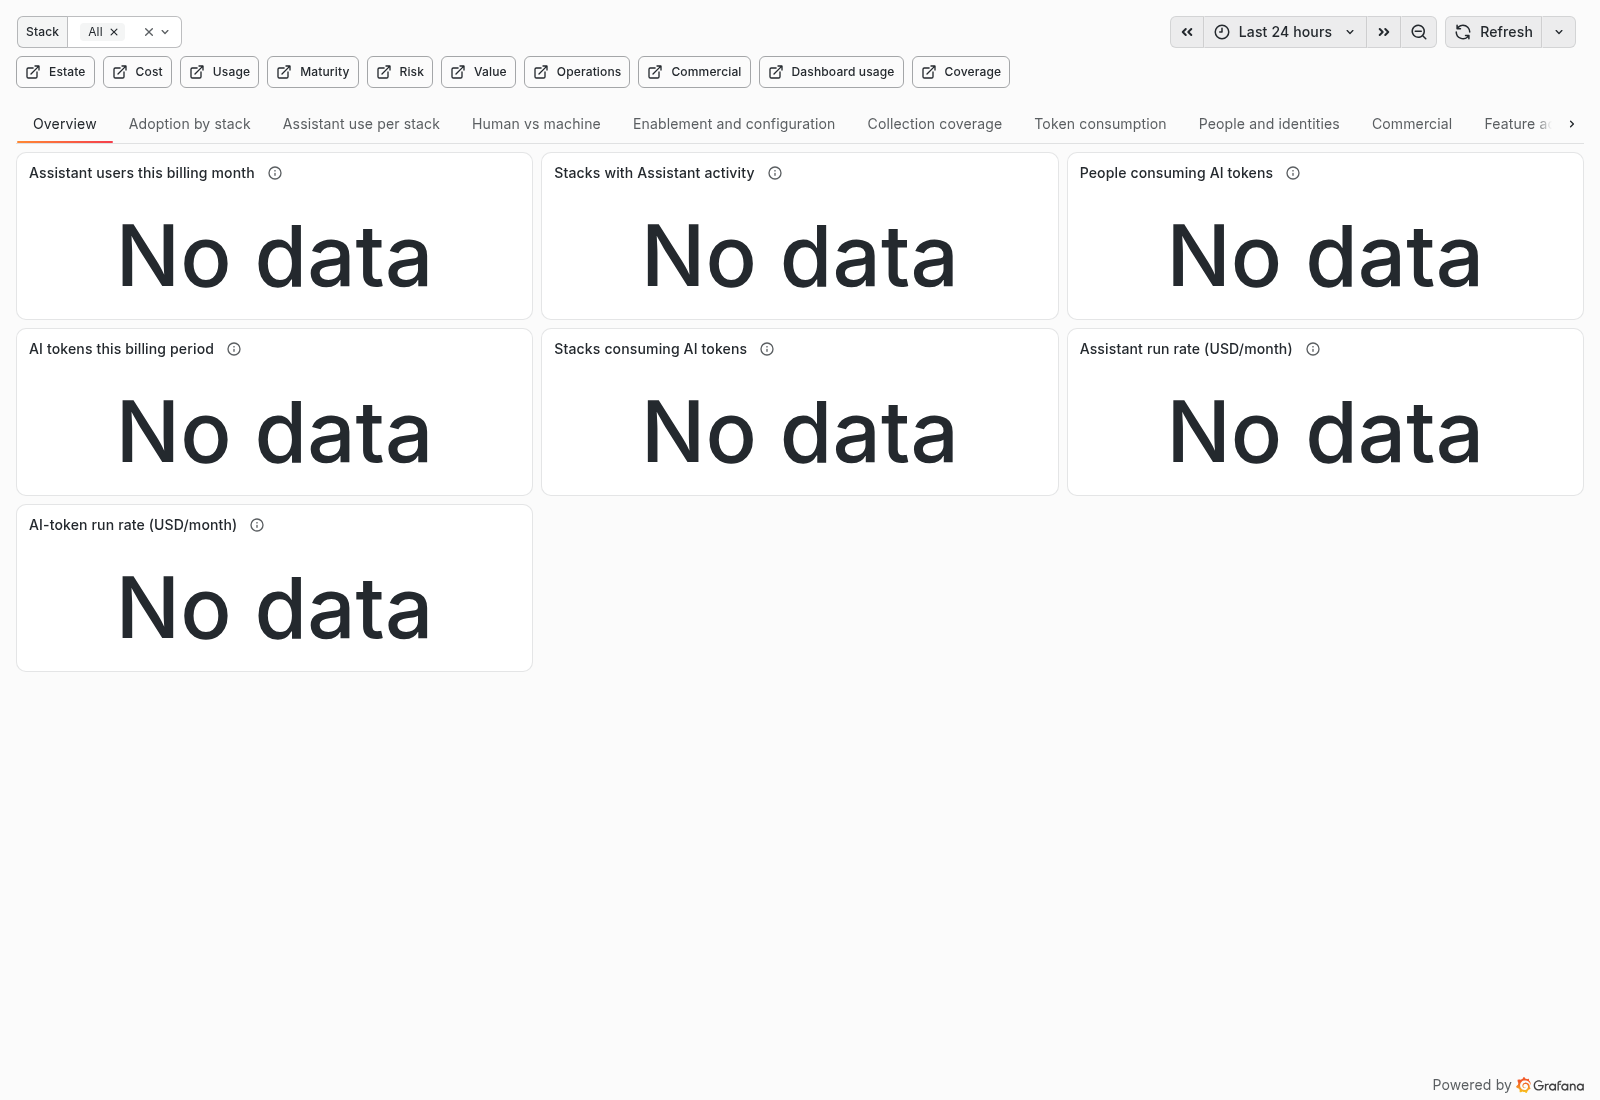
| Row or tab | Question answered | Source and window |
|---|---|---|
| Overview, Adoption by stack, Token consumption, People and identities, Commercial, Feature activity | What Assistant usage does the billing datasource report? | Live grafanacloud-usage, current billing period. |
| Assistant use per stack, Human vs machine, Enablement and configuration, Collection coverage | Which stacks report plugin usage and tenant configuration? | Daily per-stack Assistant collection, rolling 30-day plugin window. |
The billing period and rolling plugin window cannot be reconciled as the same measure. Plugin inventory is tenant-scoped: user-scoped skills and rules are invisible. Category shares describe only categorised messages and retain an uncategorised remainder. The live panels do not obey the Stack selector. Assistant traps.
Dashboard usage
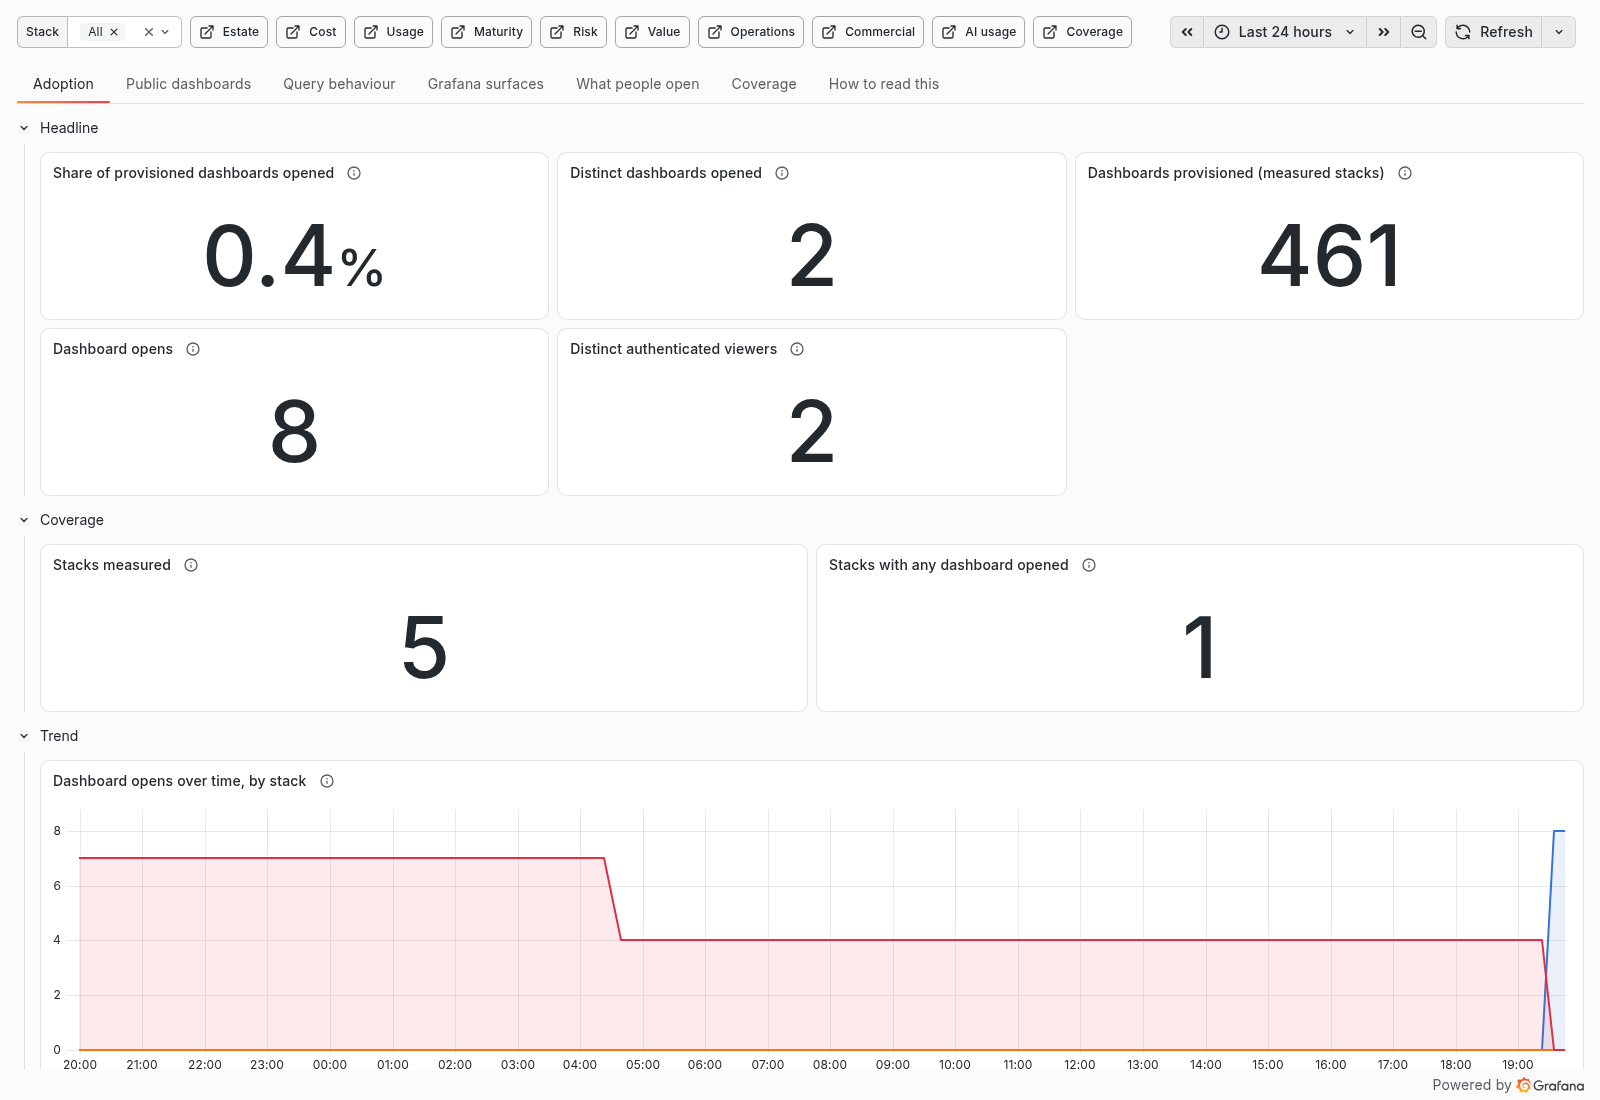
| Row or tab | Question answered | Source and window |
|---|---|---|
| Adoption, What people open | Which measured dashboards were opened, by how many authenticated viewers? | Daily per-stack usage-insights sweep over a rolling 24 hours. |
| Public dashboards | Which public shares had observed opens? | Usage-insights open events; Risk holds configured inventory. |
| Query behaviour, Grafana surfaces | What panel requests ran, from which reported surface and datasource type? | Usage-insights data-request events in the same 24-hour window. |
| Coverage | Which stacks had a readable datasource and usable events? | Per-stack reader and sweep status. |
A dashboard open is a dashboard-view event; a data-request is a query, not a page visit. A non-dashboard visit without a request is invisible. scenes combines Scenes apps, and the source does not identify individual apps. Distinct viewers summed across stacks are not org-wide unique people. Anonymous opens carry no person identity. The datasource query is scoped by each stack's instance_id. Usage-insights traps.
Query-mix panel
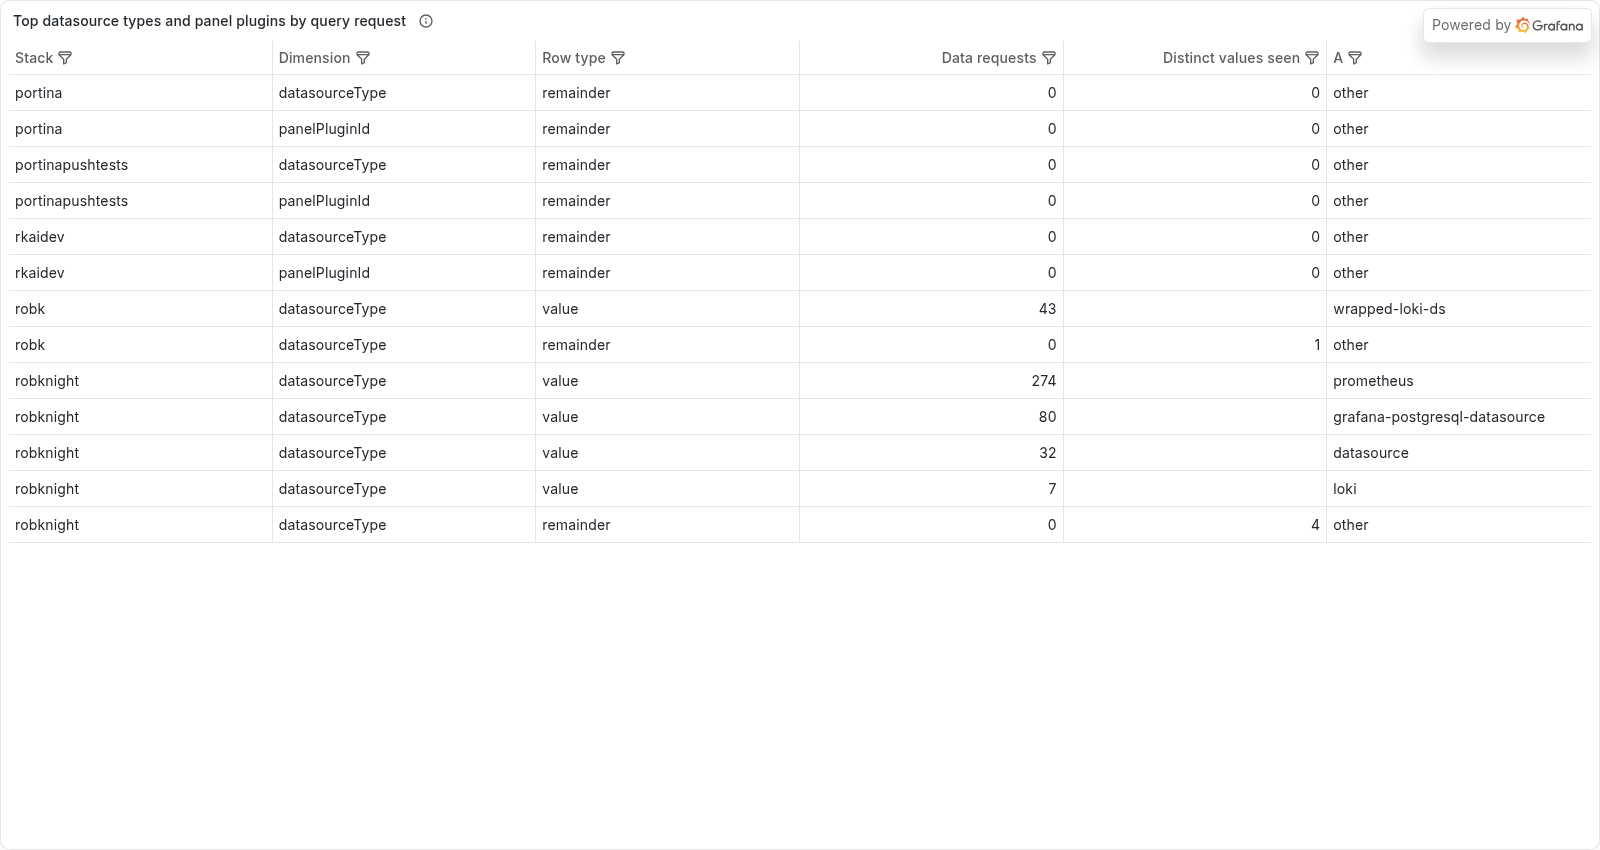
Rendered on a staff development stack on 2026-10-01 from published dashboard gcinsight-dashboards, version 4, panel 1995666127, with all stacks selected. This is the Top datasource types and panel plugins by query request table, not a whole-dashboard refresh. The displayed numeric request counts and backend names matched the actual backend data frame. The rendered backend-value column is labelled A. Zero-count remainder rows do not establish positive panel-plugin use; datasource type does not identify an app or a person.
Coverage
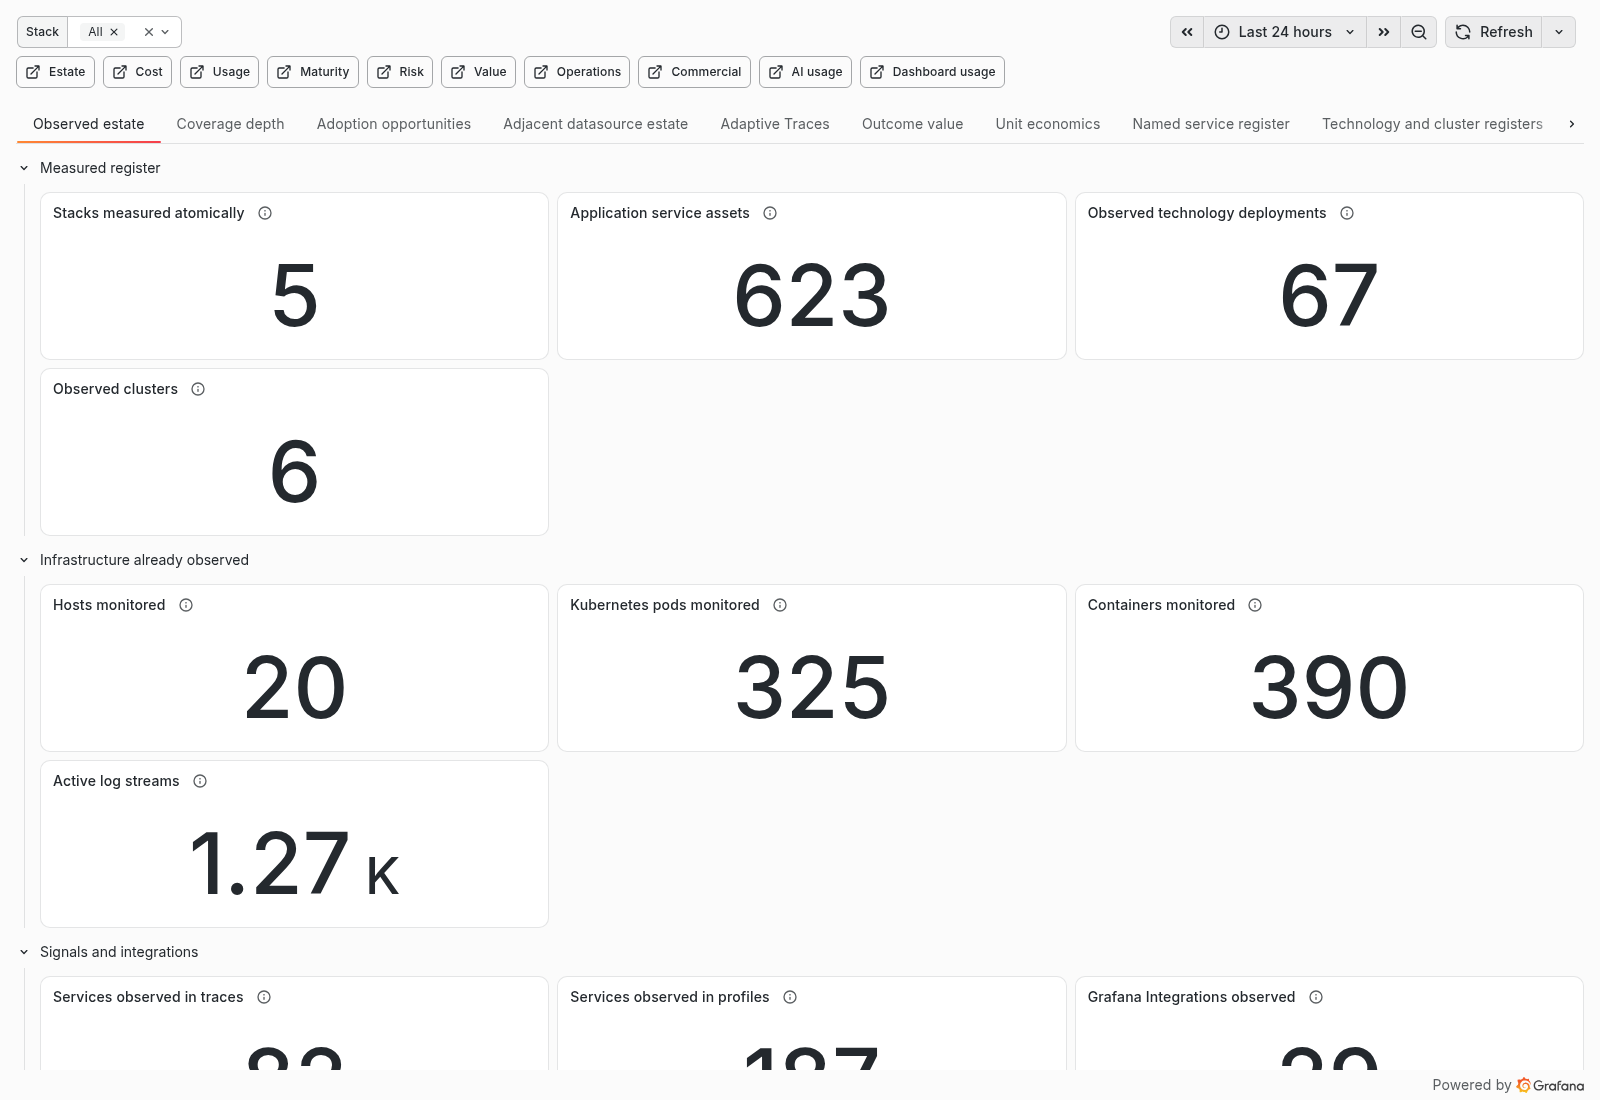
| Row or tab | Question answered | Source and window |
|---|---|---|
| Observed estate, Coverage depth, Named service register | Which named services and infrastructure assets produce signals, and how complete is their applicable coverage? | Daily explicit-window signal-label sweep and bounded S3 registers. |
| Adoption opportunities, Adjacent datasource estate, Adaptive Traces | Where do measured signals, provisioned datasources and queried types diverge? | Daily inventory and usage insights; live billing panels use 24-hour windows. |
| Outcome value, Unit economics | What recorded OnCall response and matched unit denominators exist? | Live billing datasource plus collector series. |
| Technology and cluster registers, Classification evidence, Summary | Which sentinel matches are supported, and what remains unclassified? | Versioned technology registry and daily signal inventory. |
| SLO inventory | How many SLO definitions were measured per stack, and where was the reader unavailable? | Optional, default-off daily count-only product read; no objectives, queries or history. |
Canonical service identity is exact after trim and case-folding; a generic Mimir service value stays separate. Technology matches use unambiguous sentinels, and the unmatched metric-name share is visible. Unavailable evidence leaves components unscored. Live billing panels have their own population and ignore the Stack selector. Signal and sentinel traps.
Backend producing-signal panel
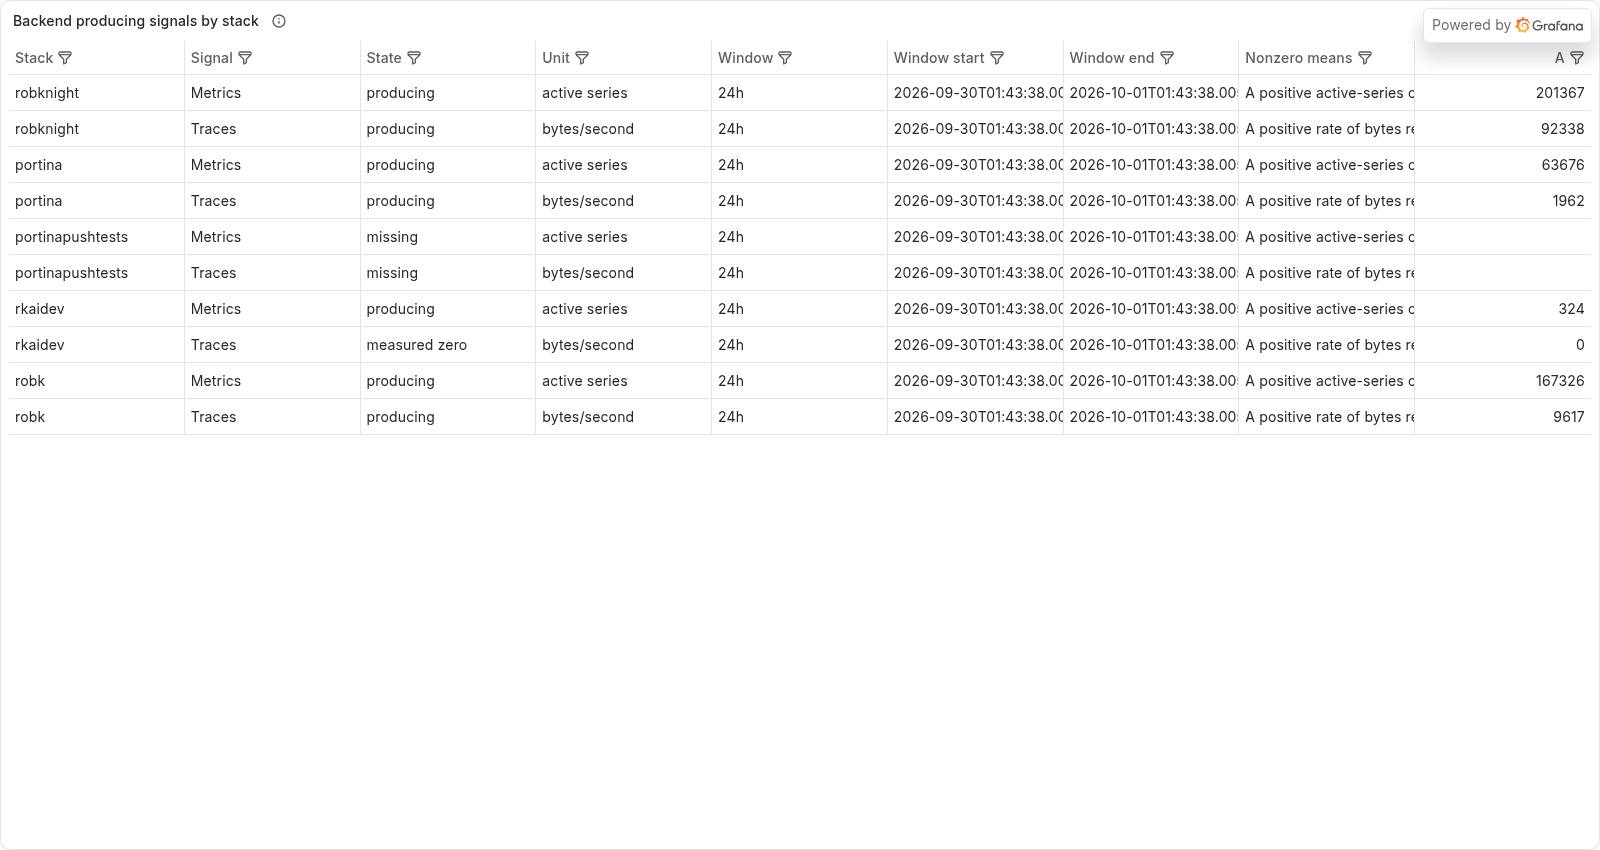
Rendered on a staff development stack on 2026-10-01 from published dashboard gcinsight-coverage, version 4, panel 302633403, with all stacks selected. This is the Backend producing signals by stack table. Its actual backend data frame matched the visible stack/signal rows, states and displayed values (rounded by Grafana). The rendered numeric-value column is labelled A; long timestamp and explanation cells are truncated in this image.
These are 24-hour peaks from the documented usage metrics: Metrics active-series count and Traces bytes received per second. missing means an absent series, not zero; measured zero means a returned zero. Positive backend production does not prove a Grafana UI visit or human use. See backend production semantics.
Both panel images above were reviewed by eye for identifiers. Their dashboard/panel JSON and actual backend data-frame text were also checked for identifiers before publication. The text checker does not scan PNG pixels. These are dated staff-estate captures, not current estate measurements or exhaustive privacy evidence.
Publishing and alerts
The builder needs published S3 views for scan-fed tables; a missing view is a build failure. Legitimately empty finding views use explicit schemas. See Getting started for a synthetic local build. Publishing writes dashboards to the chosen stack and reads them back to verify the v2 resource envelopes.
New alert rules publish paused and unrouted. Activation requires an explicit receiver; a plain publish preserves an existing rule's pause and routing. See Operations before activating a rule on a live write stack.