docdb-connection-attribution: which database user is holding DocumentDB connections open
Status: alpha. This is a reference implementation, not a supported product.
CloudWatch's DatabaseConnections metric tells you how many connections an Amazon DocumentDB instance has open, and nothing about who opened them. DocumentDB's own $currentOp lists every open connection, but an idle connection carries no user: only its client ip:port and the driver's app name. That is exactly the connection you care about when something leaks.
This example closes the gap. The DocumentDB audit log records an authenticate event with the client ip:port and the user for every new connection. A scheduled Lambda joins the two and exports a gauge per database user and app to Grafana Cloud over OTLP, with a dashboard.
What is in the release download
README.md                          this file
lambda.zip                         the function code, ready to deploy
terraform/                         Terraform root module, with lambda.zip beside it
cloudformation/template.yaml       a single standalone template
cloudformation/parameters.example.json
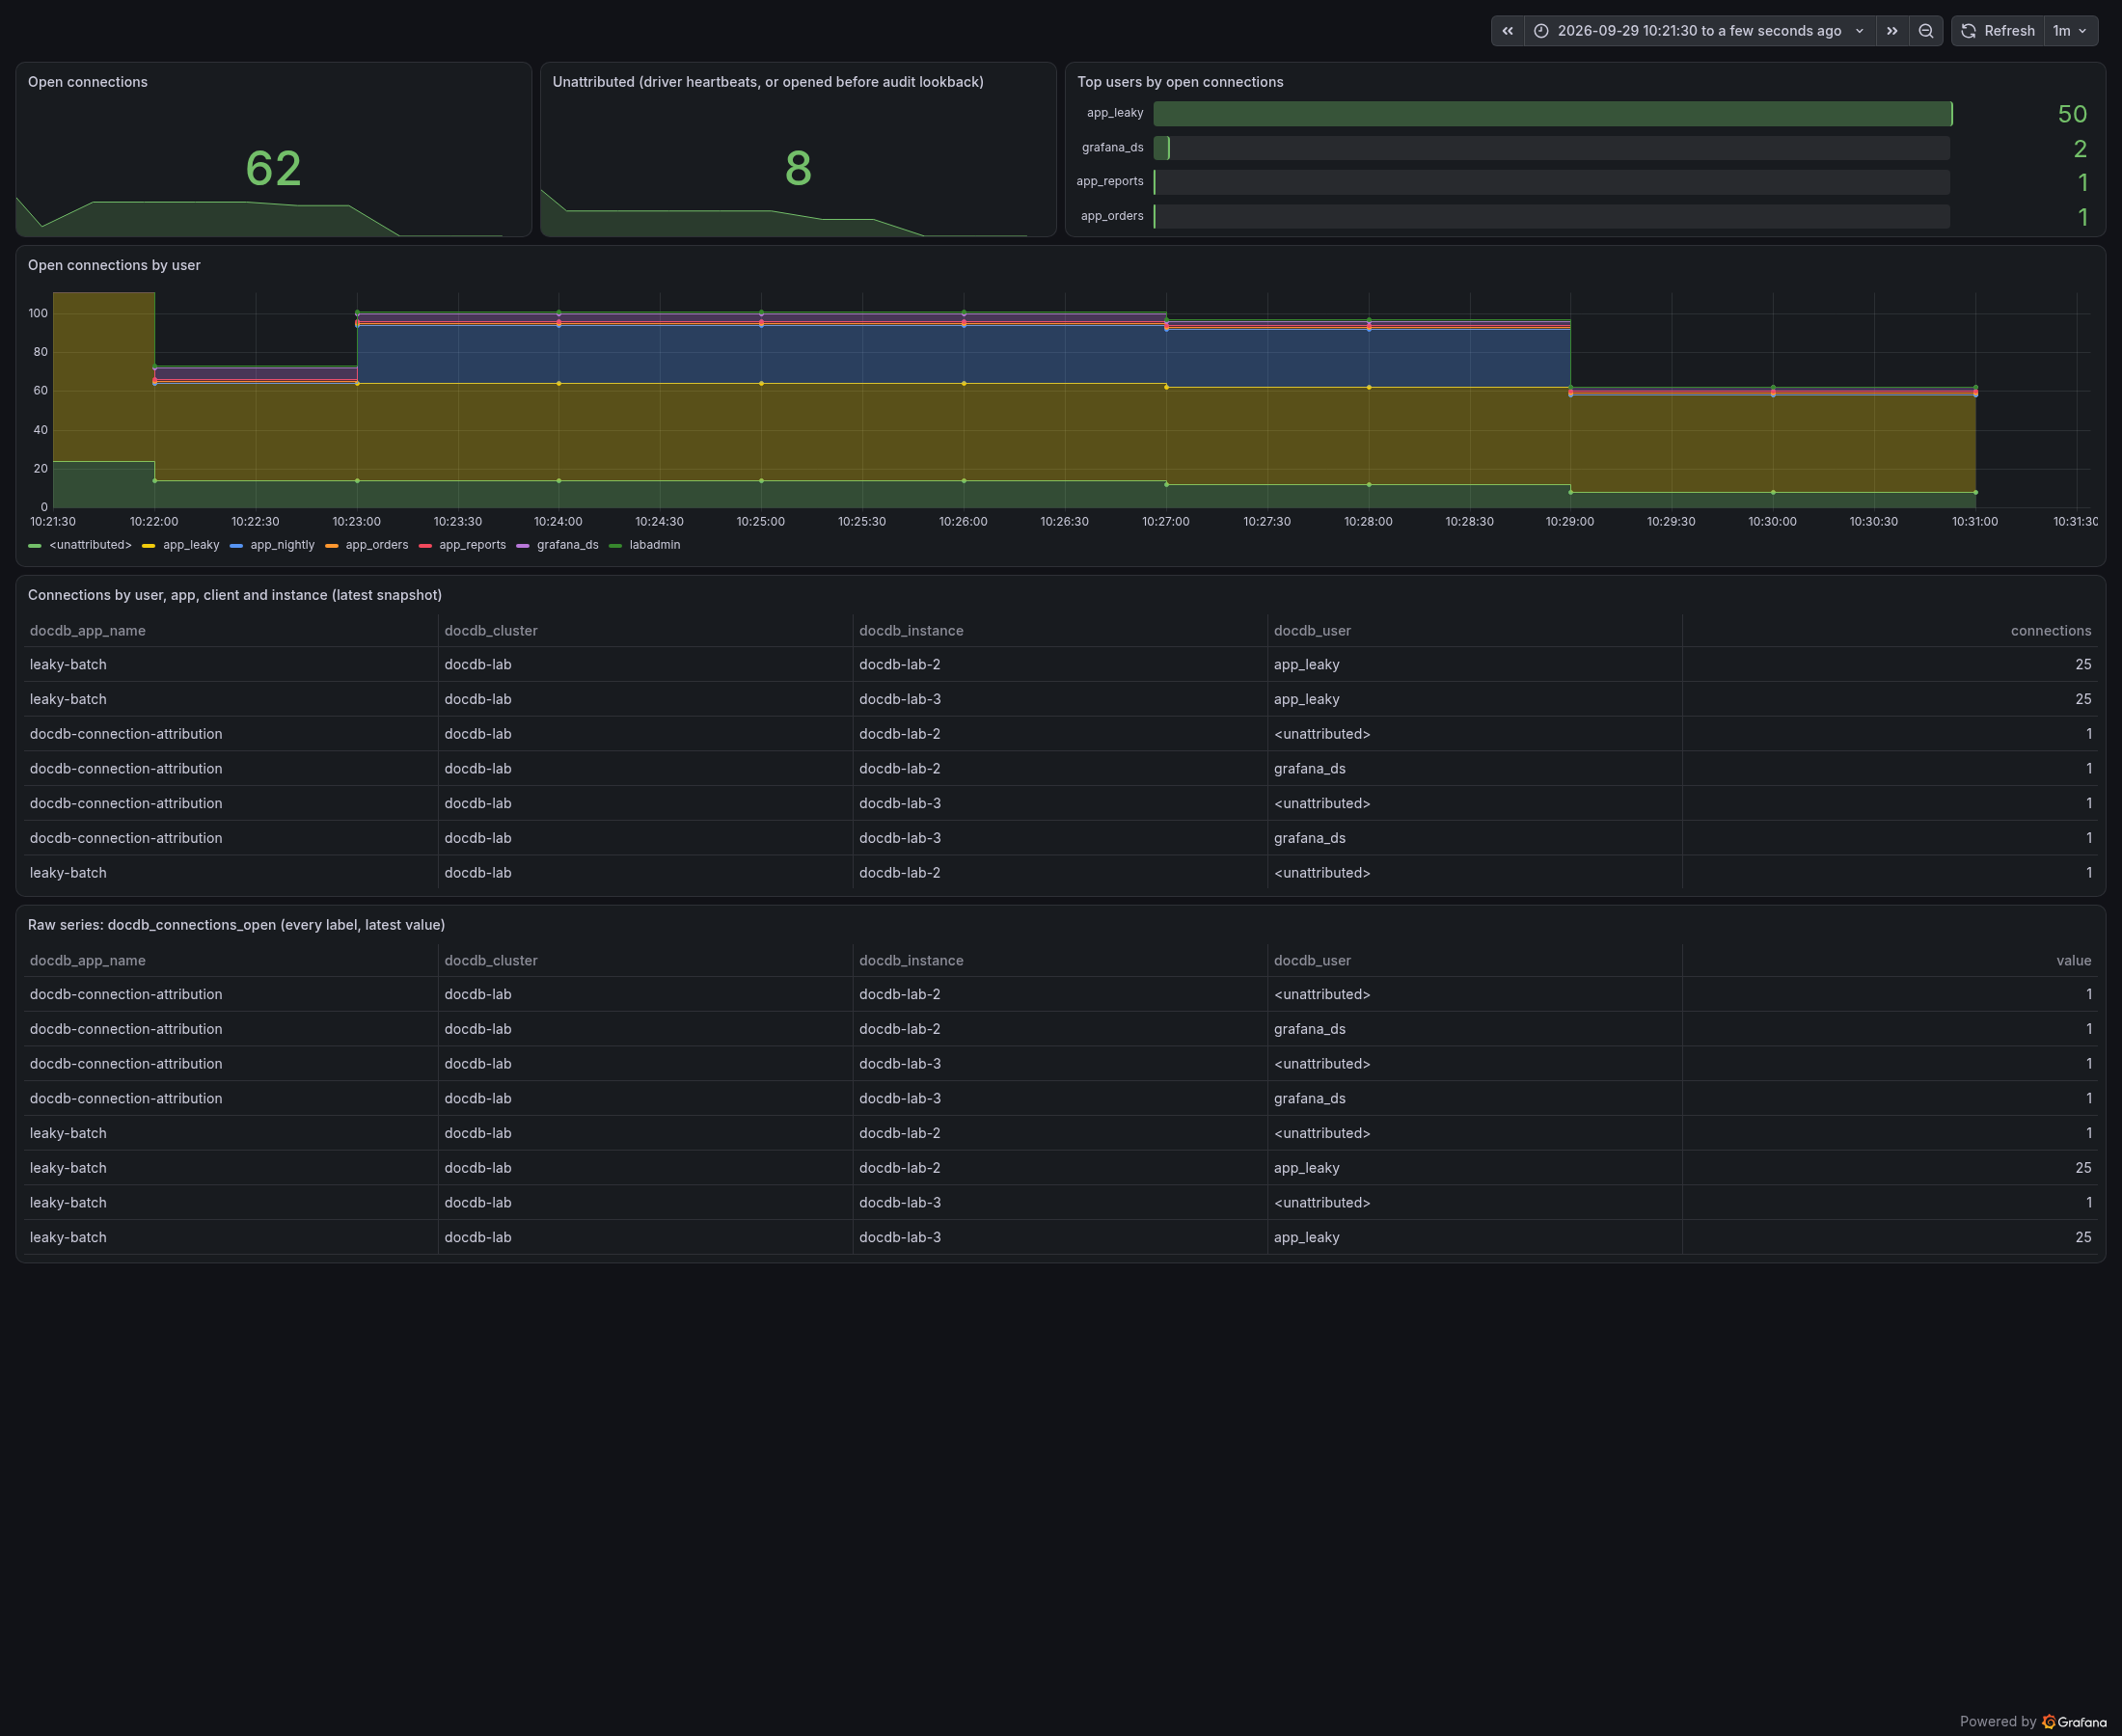
dashboards/connections-by-user.json   Grafana dashboard for the exported metric
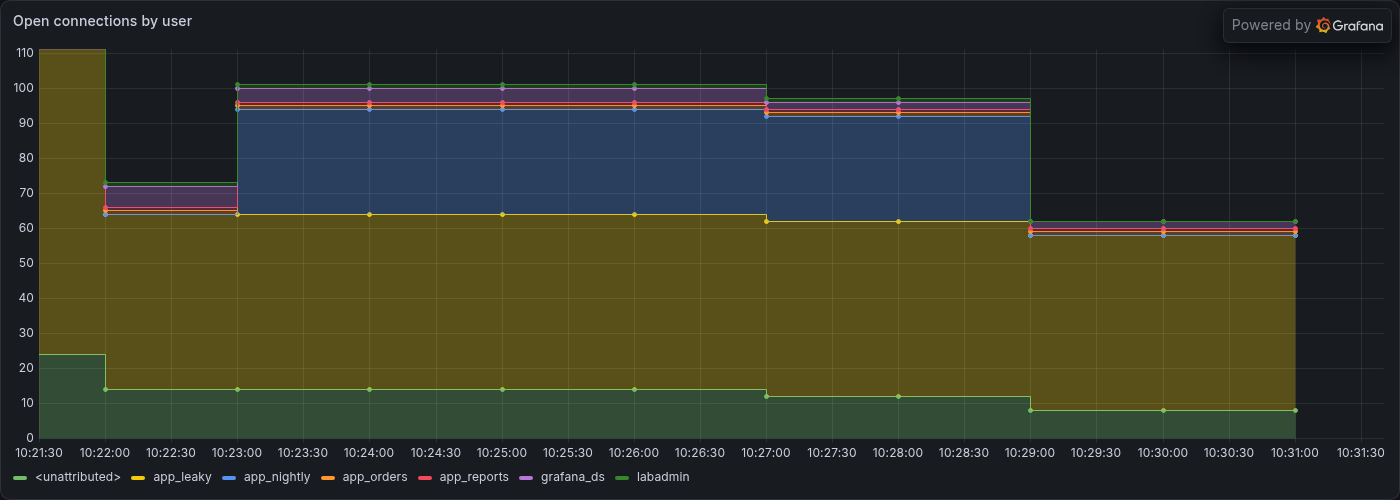
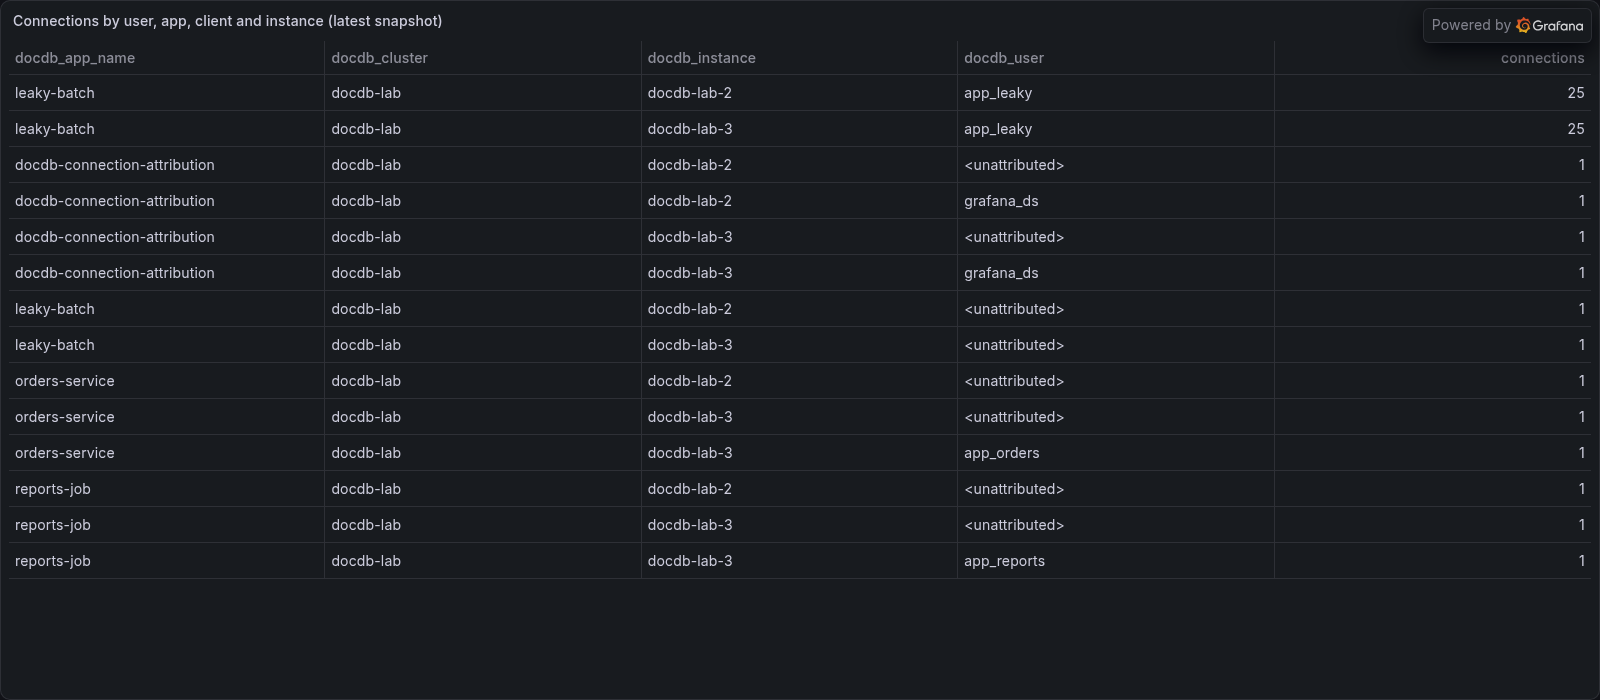
The repository also carries a traffic generator that creates lab users and a deliberate connection leak, used to produce the screenshots on this page: dev/loadgen.py.
What you need before you start
- Auditing on the cluster, exported to CloudWatch Logs. Both are required:
- A custom cluster parameter group with
audit_logsset toddl.ddlis enough, because authentication events are logged at that level; you do not need the more expensive DML auditing. Attaching a custom parameter group to a cluster only takes effect after each instance reboots; until then the parameter status readspending-reboot. - The cluster's
auditlog export enabled, which writes to/aws/docdb/<cluster>/auditwith one log stream per instance.
aws docdb create-db-cluster-parameter-group --db-cluster-parameter-group-name acme-audit \
  --db-parameter-group-family docdb5.0 --description "audit_logs=ddl"
aws docdb modify-db-cluster-parameter-group --db-cluster-parameter-group-name acme-audit \
  --parameters "ParameterName=audit_logs,ParameterValue=ddl,ApplyMethod=immediate"
aws docdb modify-db-cluster --db-cluster-identifier acme-docdb-cluster \
  --db-cluster-parameter-group-name acme-audit \
  --cloudwatch-logs-export-configuration '{"EnableLogTypes":["audit"]}' --apply-immediately
aws docdb reboot-db-instance --db-instance-identifier acme-docdb-1   # once per instance
A least-privilege DocumentDB user for the function: built-in roles
clusterMonitoronadminandreadonadmin.clusterMonitoralone is refused (code 13,Authorization failure) by the$currentOpaggregation stage the function uses.A Secrets Manager secret holding that user, as JSON in the same shape DocumentDB's own managed secrets use:
{"username": "...", "password": "..."}. Pass it as a file so the password stays out of your shell history.A Grafana Cloud OTLP endpoint, stack id and token. On your stack's details page, open the OpenTelemetry tile: it shows the OTLP endpoint (
https://otlp-gateway-<region>.grafana.net/otlp) and the numeric instance id. Create a Cloud Access Policy with themetrics:writescope, then a token on it. The OTLP instance id is the stack id: a Mimir or Loki tenant id from the same stack will not authenticate here.Private subnets that can reach DocumentDB and the internet. The function runs in your VPC. It needs to reach DocumentDB on 27017, and HTTPS egress to Grafana Cloud, the RDS CA truststore, and the Secrets Manager, CloudWatch Logs, RDS and DynamoDB APIs. A NAT gateway covers all of it.
Terraform 1.9+ with the AWS provider 5.80+, or the AWS CLI for CloudFormation.
See Grafana Cloud credentials for how to create and store the Grafana Cloud token.
What this creates in your AWS account
- The Lambda function, its execution role, an explicit log group with retention, and error and throttle alarms. Reserved concurrency is 1, because the audit checkpoint has a single writer.
- A security group for the function: no ingress; egress 443 anywhere and 27017 to the VPC.
- Optionally one ingress rule on your DocumentDB security group allowing 27017 from the function's security group, if you pass that group's id. Nothing else about the cluster is touched.
- A DynamoDB table (on-demand, TTL on
expires_at) holding which user authenticated on each client socket, plus the audit read checkpoint. - An EventBridge rule that runs the function every minute.
- Read access to the two secrets you created. It does not create or modify them.
It never writes to DocumentDB. It reads $currentOp and nothing else, and it does not change the cluster's parameter group, log exports or users.
Deploy it
Terraform
cd terraform
cp terraform.tfvars.example terraform.tfvars
$EDITOR terraform.tfvars          # cluster, subnets, both secrets, OTLP endpoint
terraform init
terraform apply
There is no backend block, on purpose. Creating a VPC-attached function takes two to three minutes while Lambda provisions its network interfaces.
CloudFormation
CloudFormation cannot upload function code from your machine, so put lambda.zip in an S3 bucket first. The template takes the subnets as a list and needs the VPC CIDR for the 27017 egress rule.
aws s3 cp lambda.zip s3://my-artifacts/docdb-connection-attribution/lambda.zip

aws cloudformation deploy \
  --template-file cloudformation/template.yaml \
  --stack-name grafana-cloud-docdb-connection-attribution \
  --capabilities CAPABILITY_IAM \
  --parameter-overrides \
      DocDbClusterId=acme-docdb-cluster \
      DocDbCredentialsSecretId=docdb/connection-attribution \
      DocDbSecurityGroupId=sg-0123456789abcdef0 \
      GrafanaCloudOtlpEndpoint=https://otlp-gateway-prod-eu-west-2.grafana.net/otlp \
      CredentialsSecretId=grafana-cloud/otlp \
      VpcId=vpc-0123456789abcdef0 \
      SubnetIds=subnet-0123456789abcdef0,subnet-0fedcba9876543210 \
      VpcCidr=192.0.2.0/24 \
      LambdaCodeS3Bucket=my-artifacts \
      LambdaCodeS3Key=docdb-connection-attribution/lambda.zip
Check it worked
- Run it once by hand rather than waiting for the schedule:
aws lambda invoke --function-name "$(terraform output -raw function_name)" /tmp/out.json
cat /tmp/out.json
A healthy run returns a summary such as {"connections": 62, "unattributed": 8, "series": 14, "audit_events": 221, "audit_complete": true, "failed_instances": []}. The first run reads up to a week of audit history, so audit_events is large once and small after that.
Read the function's own log line, which carries the same summary.
Find the data in Grafana Cloud. In Explore, on your stack's Prometheus data source:
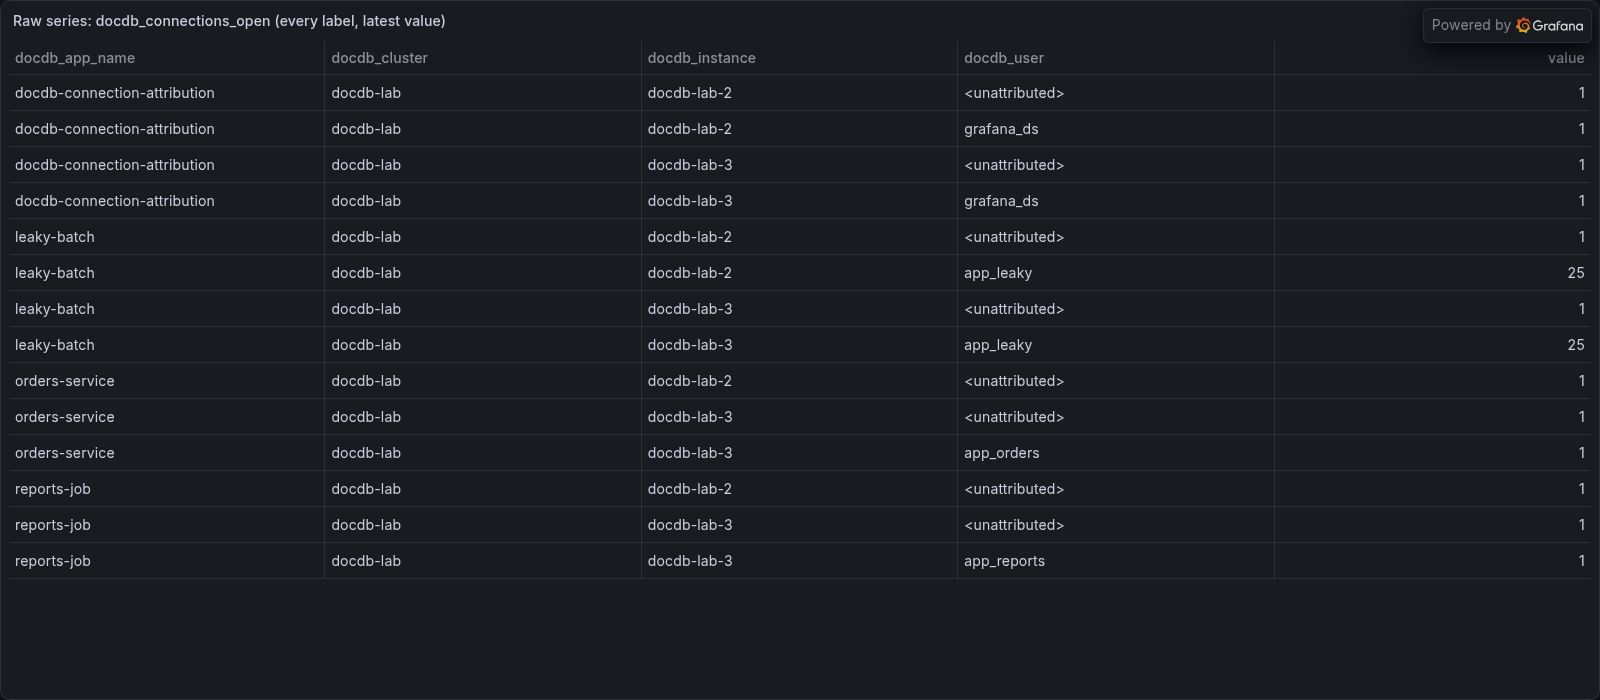
Expect one series per instance and user. The function's own user appears with one connection per instance.
- Import the dashboard. In Grafana, Dashboards -> New -> Import, upload
dashboards/connections-by-user.json, and choose your Prometheus data source.
- Confirm nothing is stuck.
audit_completeshould betrueon every run after the first few.falsemeans the audit read is still working through a backlog; it resumes where it stopped on the next run.
Configuration
| Environment variable | Default | Meaning |
|---|---|---|
DOCDB_CLUSTER_ID | required | Cluster identifier. Every available instance in it is queried. |
DOCDB_CREDENTIALS_SECRET_ID | required | Secret with {"username", "password"} for the least-privilege user. |
AUDIT_LOG_GROUP | /aws/docdb/<cluster>/audit | Where the cluster exports its audit log. |
AUDIT_BACKFILL_MINUTES | 10080 (7 days) | How far back the first run reads. |
MAPPING_TTL_DAYS | 14 | How long a socket-to-user mapping lives without being seen. |
GRAFANA_CLOUD_OTLP_ENDPOINT | required | OTLP gateway base URL, ending /otlp. |
GRAFANA_CLOUD_CREDENTIALS_SECRET_ID | required | Secret with {"tenant_id", "token"}, or a bare token. |
INCLUDE_CLIENT_ADDRESS | false | Add the client host (no port) as the client_address label. |
LOG_LEVEL | INFO | The function's own log level. |
The schedule is rate(1 minute) by default.
Metrics, and what deliberately is not a label
| Metric (in Mimir) | Labels |
|---|---|
docdb_connections_open | docdb_cluster, docdb_instance, docdb_user, docdb_app_name, optionally client_address |
docdb_attributor_audit_events | docdb_cluster |
docdb_user is <unattributed> when no user could be found; see Limitations. The client port is never a label: it is different for every connection, so it would create a series per connection. See OTLP vs Loki Push for why this example exports over OTLP rather than pushing logs, and Loki Ingestion for the general label discipline every example in this repository follows.
Each run pushes one snapshot, and nothing marks a series stale when its last connection closes. Query with last_over_time(...[2m]), a window of at least two schedule intervals, or a closed connection keeps showing for the 5-minute Prometheus lookback. The shipped dashboard does this.
What it costs
- Lambda: 1,440 runs a day at 256 MB and typically 1 to 8 seconds each. A few cents a day.
- DocumentDB audit log ingest into CloudWatch Logs is usually the largest line, and it is driven by how often your applications open connections, not by this example. The lever is connection pooling in your applications, which is also the fix for most leaks.
- CloudWatch Logs
FilterLogEvents: one short read of new events per run. - DynamoDB on demand: one write per new client socket, one batch read per run, and one TTL-refresh write per long-lived connection.
- Grafana Cloud: one active series per (instance, user, app), plus the client host when enabled. Tens of series for a typical cluster.
- NAT gateway data processing, if the function's egress goes through one.
Troubleshooting
The run fails with Authorization failure (code 13). The DocumentDB user has clusterMonitor but not read on admin. Grant both.
Every connection is <unattributed>. No authenticate events are reaching the function. Check that the log group exists and has recent events. If it is empty, audit_logs is not applied (the instance still needs its reboot) or the audit log export is not enabled.
A few connections per instance are always <unattributed>. Expected. Every driver keeps one or two monitoring (heartbeat) connections per server that never authenticate.
The function times out with no log line. It cannot reach something: DocumentDB on 27017, or HTTPS egress. Check the subnets' route to a NAT gateway, and that the DocumentDB security group allows 27017 from the function's security group.
OTLP metrics export to Grafana Cloud failed with a 401 above it. The tenant id is not the stack id, or the token lacks metrics:write. The OTLP gateway takes the stack's numeric instance id, not a Mimir or Loki tenant id.
certificate signed by unknown authority or x509 errors. The function could not fetch the RDS CA bundle, or you pointed DOCDB_CA_BUNDLE_URL at the wrong file.
audit_complete stays false. The audit backlog is larger than one run can read. Each run continues from its saved page, so this clears on its own; a very busy cluster can take several runs after the first deploy.
The dashboard still shows a connection that has closed. The query is not bounded by last_over_time; see the note under Configuration.
Limitations
- Connections opened before the audit history reaches cannot be attributed. The first run reads back
AUDIT_BACKFILL_MINUTES(7 days by default). Raise the backfill if your log group retains more. - A reused client port can briefly be attributed to its previous user. The join matches on
ip:port. An active connection's own user always wins over the audit match; only idle connections on a reused port in the gap before the new event arrives can be wrong. - Attribution lags new connections by the audit delivery delay, usually under a minute.
- The dashboard can only show what
$currentOpreports. It does not show connections held open by a proxy on your side. - Grafana's MongoDB Enterprise data source cannot replace this function.
$currentOpmust run as a database-level aggregate, so every form of the query is rejected by that data source. - Tested on DocumentDB 5.0 instance-based clusters. Elastic clusters are not covered.
How it works
Each run does three things.
- Reads new audit events.
FilterLogEventson the audit log group, filtered toauthenticate, from a checkpoint stored in DynamoDB. Each event givesremote_ip(which includes the port) andparam.user. The function keeps the newest event per socket and writes it with a condition that stops an older event from overwriting a newer one. Windows overlap by five minutes so late-delivered events are not missed. - Lists open connections on every instance.
$currentOpwith{allUsers: true, idleConnections: true}only reports the instance it runs on, so the function connects to each instance endpoint directly, reusing its client across runs so that it does not add an authenticate event of its own every minute. - Joins and exports. Each connection's
clientis looked up in the table. An active connection's owneffectiveUserswins, because it is current; an idle one takes the audit match. The counts go out as an OTLP gauge, withservice.instance.idfixed per cluster so a Lambda cold start does not begin a fresh set of series that double-counts across the query window.
The mapping lives in DynamoDB rather than in memory because a leaked connection can stay open for days after the only audit event that names its user, far longer than a Lambda execution environment lives.
More detail
The full README, including the dashboard JSON and the load generator, ships inside the release zip and is also on GitHub.